
Interplace
168 episodes — Page 4 of 4

The Obscene Man
Hello Interactors,Today we begin the summer series on the environment. I didn’t seek learning about the physical world intentionally; I was more interested in maps. But as a geography major it’s unavoidable. Now I’m glad I was exposed to the workings of the natural world as we’re confronted with its wrath on a daily basis. Which begs the question, When did this calamity all start and what should we call it?As interactors, you’re special individuals self-selected to be a part of an evolutionary journey. You’re also members of an attentive community so I welcome your participation.Please leave your comments below or email me directly.Now let’s go…ENVIRONMENTAL DISCLOSURE FROM SNOWY JEFF DOZIER I typically didn’t sit in the front of the class, but I was running late and the seats in the circular shaped domed Campbell Hall were full. It was a required class, Physical Geography 101, taught by geography legend, Jeff Dozier. By this point, Jeff had already earned a reputation for being a snow expert. Students would clamber to join him as a research assistance climbing up and skiing down Mt. Shasta studying snow hydrology. Nobody knows snow like Jeff. Who did Disney call to explain the dynamical elements of snow crystals to animators of the popular movie, Frozen? Dozier.I ended up sitting in the front row from that point forward; not so much because I was interested in the topic, but because I wanted to see if I could hear what he was mumbling before the start of every class. He would pace back and forth on stage talking to himself as if nobody was there. Occasionally our eyes would lock, he’d blink a couple times staring at me, and then unexpectedly snap out of it. I think he clued on to me later in the term as the blank catatonic stare morphed into a sly grin and a gentle nod. Maybe I was more interested in observing this star-studded snow expert than I was physical geography.His research over the last 40 years has been groundbreaking. In addition to dangerous and difficult field work in the nooks and crannies of mountainous cliffs and creeks revealing marvels of the molecular structure of snow, Jeff was equally comfortable behind a screen as a pioneering pixel prognosticator. As high quality digital imagery of the earth started flowing from satellites circling the globe, he realized much could be gleaned from the array of tiny white dots of varying intensity shining back at him through zoomed-in pictures of snow covered mountains; much of which inaccessible by foot or by ski – even by the most motivated graduate student.With the radiance of a single pixel at one end and the physics of the silicon imaging sensor at the other, Jeff could determine mathematically how the atmosphere effected the radiation of light reflecting off the microscopic ice crystals that make up a snowflake. Later, with the help of a colleague, he also discovered this technique could be used for the opposite of snow – fire. Examining pixelated satellite imagery from the Persian Gulf, they detected anomalous glowing spots that dotted the landscape. These dots turned out to be small methane burn-off flames used in oil refineries. It was 1980 and for the first time a tiny fire could be detected from space. Soon he was able to determine land surface temperatures just by analyzing a satellite image. Remote sensing, spectroscopy, and biogeochemisty have come a long way in 40 years; so have fires – as dire global warming melts precious snow away like teardrops rolling down the creeks on the face of mother earth. DIRTY SNOW AND ALLUVION FLOWWhile Dozier was looking at the earth’s surface for climatic clues, other researchers were digging deep. Since the late 60s scientists have been extracting two-mile long ice cores out of snowpack in Greenland and Antarctica. More cores around the globe have been plucked out of glaciers before they all recede. Stacked in these cylindrical cores are stratified lines representing a geological timeline. Toward the top are layers of white loosely granulated snow crystals with barely discernable lines of annual layers of snowfall, then come darker compressed layers of rock, silt, and sand, with the bottom layers typified by dense dirty-brown ice. Some of these cores contain 750,000 year old natural elements.These layers of ice allow scientists to travel back in time revealing snow fall levels, the direction the wind was blowing as the snow drifted, and the air temperature. By looking at the ratio of ‘light’ and ‘heavy’ atoms found in oxygen trapped in the ice, scientists can’t discern exact daily temperatures, but they determine average air temperatures or identify trends over select periods of time. Other clues can be found as well; like elements in the atmosphere. As snow piles miles deep they compress lower layers ice pockets of atmospheric gas that become securely enshrouded. These gassy envelopes reveal to scientists the amount of methane and carbon dioxide in the atmosphere at the time of the snow fall. As water
Cul-de-sacs, Caucasians, and the Kansas Garden City
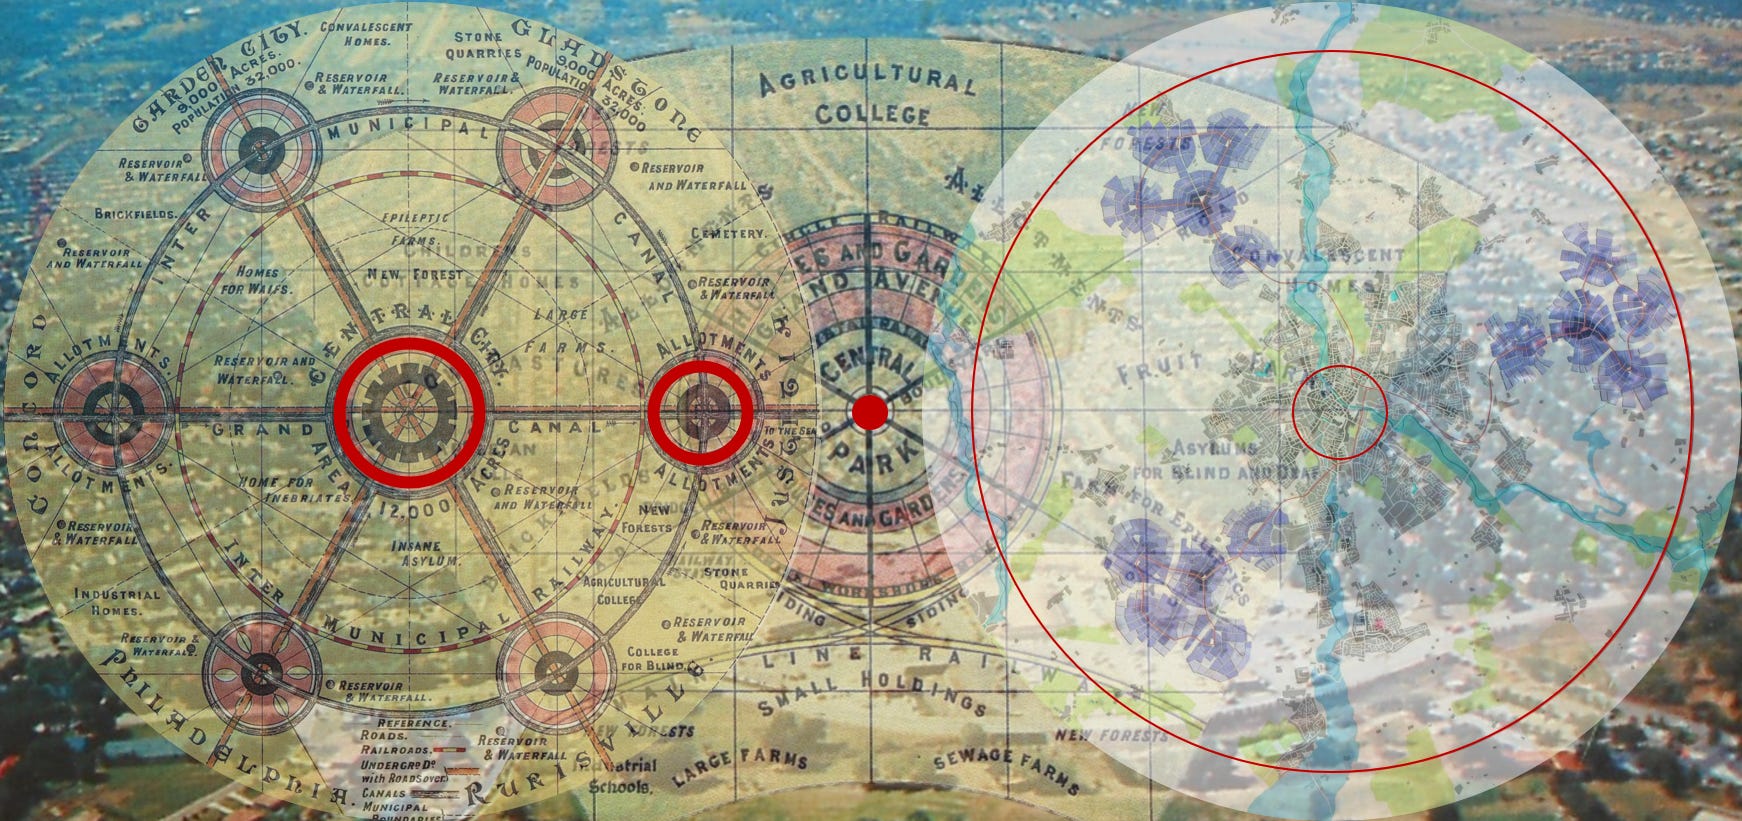
Hello Interactors,This is the last post of the Spring 2021 cartographic portion of Interplace. My recent trip to Kansas City got me thinking about the role land use mapping and planning played in the formation of select surrounding suburbs.It’s also a bit of a teaser for the Summer season as Interplace moves toward the environment, physical geography, and its role in urban planning and design.As interactors, you’re special individuals self-selected to be a part of an evolutionary journey. You’re also members of an attentive community so I welcome your participation.Please leave your comments below or email me directly.Now let’s go… LIFE AT THE BOTTOM OF THE SACKOne glance out the window as you fly into the Kansas City airport and the gridding of American land becomes apparent. A array of crops, fields, and irrigation circles all stitched in and bordered by hard edged polygons but also gently meandering rivers and streams. It’s all part of the grand plan to divide the organically occurring hills and valleys of America into artificial two dimensional polygons. A tapestry of maps for settling colonists that doubles as a ledger for settling government’s finances.The patterns are apparent at the street level too. The main arterials are uniformly distributed and connected at intersections; east-west and north-south thoroughfares that reach far beyond the core of the city. But just off these axes of expansion are sweeping tree lined curvilinear roads featuring large deciduous trees with canopies of leaves floating over a pool of manicured Kentucky bluegrass. And nestled within are the beloved single family homes. A community planned from above on a map that sells an illusion of a naturally occurring pastoral ideal. A residential product planned, designed, and manufactured for settling White suburban colonists. Like me.I grew up on a cul-de-sac in a planned community in Norwalk, Iowa. It doesn’t get anymore suburban than a cul-de-sac. I admit, it was nice. The center of the street featured a domed grassy circle that the neighborhood kids would all use to play kick-the-can. We’d place the can atop the center of the mound and then run and hide behind the surrounding houses and bushes. Cul-de-sacs are great for families because they’re dead ends. The literal French translation is ‘bottom of the sack’. The only cars, which was rare, were driven by the parents of the kids playing in the street. Parents of this generation knew the benefits of playing in the road because it was a lawful thing to do when they were kids. But with the rise of the automobile came laws that made it illegal to play in the street. Sadly, it still is. Our little cul-de-sac was part of Norwalk’s first annexation; just four years after I was born. After we had all grown, my parents moved to Overland Park, Kansas to retire. Overland Park was founded around the same time Norwalk was incorporated in 1905. And like Norwalk, its founding was driven by the railroad, but its expansion was driven by the automobile. The growth of roads in suburban America correlates with the annexation of land throughout the 50s and 60s. Favorable home loans from the Federal Housing Administration (FHA) helped too. As did redlining – the discriminatory delineation of red lines on ‘residential security maps’ where home loans were denied due to the area resident’s racial and ethnic origins. Overland Park annexed developments for decades making it the second most populous city in Kansas (behind Wichita). This area of Johnson Country was developed primarily by the Kroh Brothers Development Company after World War II. They, like the more famous area developer J. C. Nichols, were deemed “community builders” and benefited from building subsidies flowing from the FHA. But the communities they were building were strictly White. Using harsh racist covenants and deeds, they controlled who could buy homes in these suburbs. Here’s how the deed read for Leawood Estates, a community that shares the eastern border of Overland Park. “None of said lots or portions of lots shall ever be sold, conveyed, transferred, devised, leased or rented to or used, owned or occupied by any person of Negro blood or by any person who is more than one-fourth of the Semitic race, blood, origin, or extraction, including without limitation in said designation, Armenians, Jews, Hebrews, Turks, Persians, Syrians, and Arabians, excluding, however, from the application of this paragraph partial occupancy by bona fide domestic servants employed thereon.”EBENEZER’S POLAR PLUNGE These satellite cities just beyond the reach of the city are associated with the post war rise of wealth and the automobile. But this method of mapping and planning had been around much longer. Ebenezer Howard introduced the concept of a ‘Garden City’ in 1895 in England in response to the overcrowding, congestion, and pollution that came with the industrial age. It’s a method of city planning that was cross-referenced by the City Beautiful Mov
Spring 2021 Cartography Review
Hello Interactors,This week I’m coming to you from Kansas City. My plan was to avoid the hot and humid Midwest summer to visit family, but instead I’m battling a heat wave and soon a thunderstorm. It made me wish I’d done a post on weather maps.As a result, this week’s installment is a review of my spring posts on cartography as we approach the last week of the season. Next up is summer and the role the physical environment plays in the interaction of people and place. This spring I’ve chronicled the role various elements of map-making have played in the formation of the United States. Starting with an ancient history of cadastral mapping and how Thomas Jefferson took a page from the Egyptians and the Roman empire, then the progression of organized surveying for land capture across the country, and finally how maps serve as forms of persuasion, manipulation, and control.I’ll be back next week with the final post of the season.Now let’s go…back to April.01 : A Groma from Rome Finds a New HomeHow large scale precision cartography rose and fell with the Roman Empire, disappeared for centuries, and then re-emerged in the rise of a new empire.This post looks behind the origins of the neatly organized geometry that chop most of America into a Cartesian grid. Mapmaking’s history dates back to ancient times – as do the motivations behind them. While maps help us to better understand and interact with the world, they also help establish authority and control.https://interplace.io/p/a-groma-from-rome-finds-a-new-home02 : A Nation SquaredHow Thomas Jefferson's vision of a gridded nation squared with his desire for an interracial slave-free 'Continental America'.Jefferson had appointed Thomas Hutchins to be Geographer of the United States in 1781. In 1784 Jefferson was preparing for expansion west and was combing over Hutchins’ descriptions of what lie west of his beloved Virginia. Jefferson was dubious of Hutchins’ mapping facts and took it up with him in a personal correspondence. What follows is the unfolding of a cartography project of Roman scale. And the birth of an empire.https://interplace.io/p/a-nation-squared03 : Miami Priced, Ohio DicedFrom war veteran cronies scheming a land grab at a bar in Boston to the banks of the Ohio River with the threat of angry native resistors breathing down your neck.Thomas Jefferson had a vision of a neatly portioned empire, just as the globe was neatly partitioned into a grid of latitude and longitude lines. Sure he wanted land for farmers, but he also needed to extract property tax revenue to fill the newly formed government’s coffers that had been emptied by the Revolutionary war. The task of surveying and mapping fell on the shoulders of America’s first and only chief Geographer, Thomas Hutchins. Like most things in colonial America, it wasn’t easy.https://interplace.io/p/miami-priced-ohio-diced04 : Guns, God, and GoldA quest for wealth leads to pain through the crafting of a cartesian plane as war breaks out across the Ohio plains.This is the third in a series on the role surveying and cartography played in the establishment of the United States. It continues further west into Ohio in the lead up to the 1800s. The U.S. government needed money to fulfill their dreams of being a global superpower. And it all hinged on Jefferson’s plan to extract money from neatly surveyed squares of land occupied by sovereign Indigenous nations who had been here for thousands of years. They were not going to give in easily and they never will.https://interplace.io/p/guns-god-and-gold05 : Make Your Own Survey in Under a DayHow Thomas Jefferson’s vision of mapped agrarian squares was realized by farmers dividing their own shares.This wraps up the April series on the role large scale surveying played in determining how people of the United States of America interact with each other and the government. Jefferson had a vision for the country that combined his desire for agrarian expansion west and building an empire. It turned out to be easier for farmers to claim land than he could have imagined. https://interplace.io/p/make-your-own-survey-in-under-a-day06 : You Are What You MapHow triangles, topology, quadrangles, and cartography yield maps that can skew both messages and time.This branches into topography and the role western colonial expansion plays in the creation and articulation of our naturally occurring geography. Most of us are not very skilled at critiquing the role maps have played in shaping how we see the globe and the people on it. However, I’m optimistic that when we do we can better confront the boundaries that maps have created between people and place.https://interplace.io/p/you-are-what-you-map07 : The U.S. Census: Mapping a Sense of UsHow a Swedish Zoologist and the birth of census 'big data' led to American racism at the hands of statisticians and geographers.We’re learning every day just how embedded racism is in the workings of the American polity. This post is critical of
Maps as Logos; Atlases that Impose
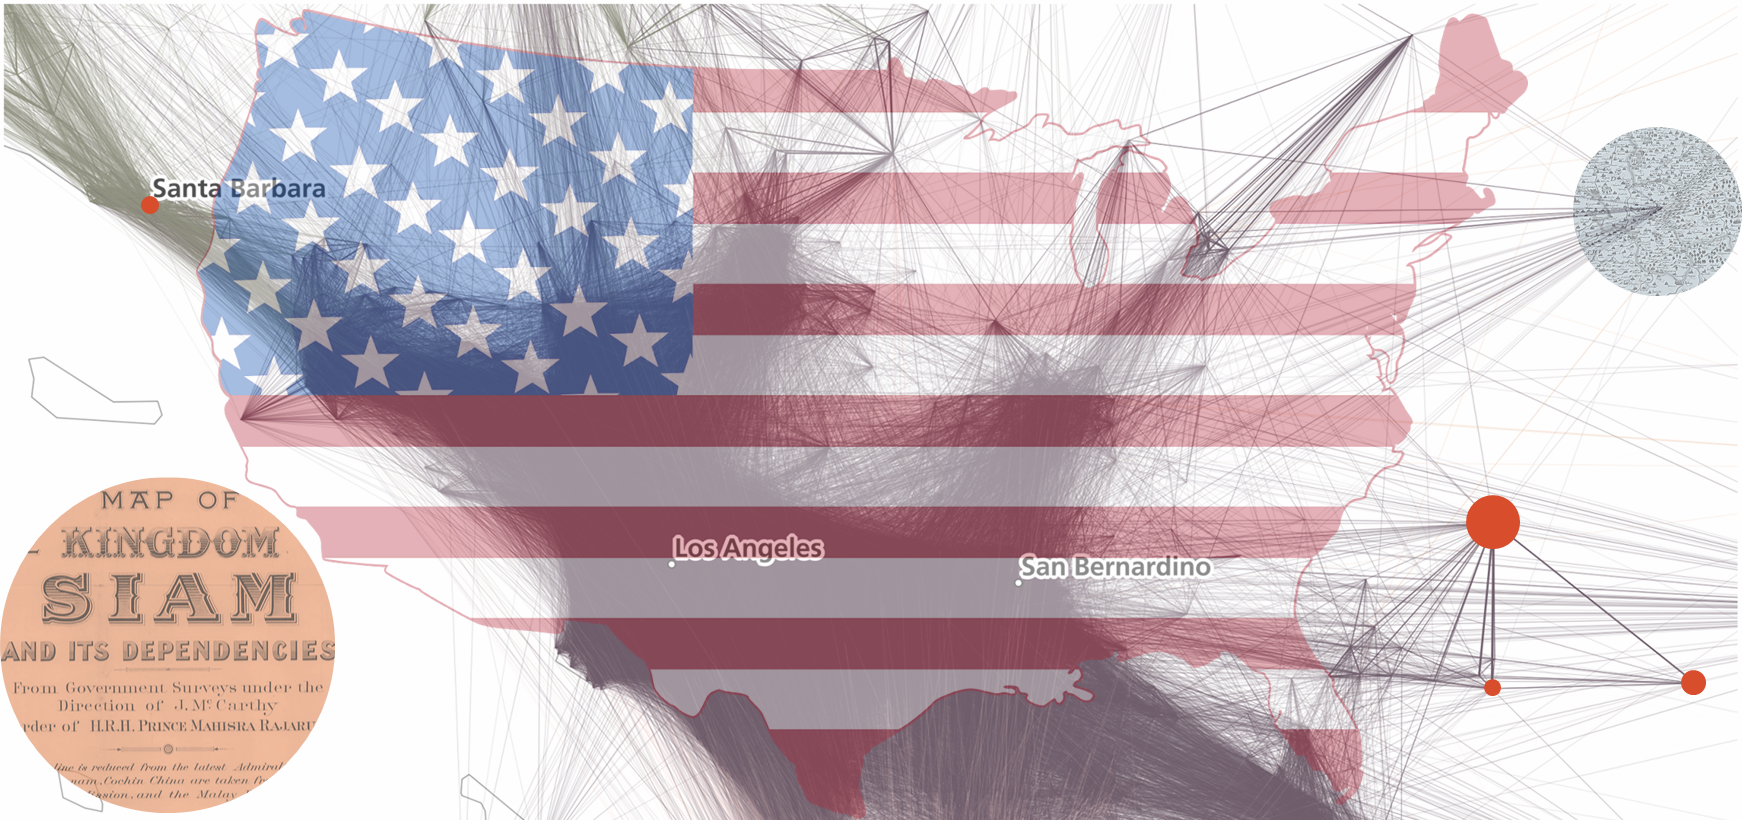
Hello Interactors,The shape of national maps are no accident. They’re not even natural. They’ve been created with intent. Yes, they represent political boundaries, but they also sell a brand.As interactors, you’re special individuals self-selected to be a part of an evolutionary journey. You’re also members of an attentive community so I welcome your participation.Please leave your comments below or email me directly.Now let’s go…LOCO FOR LOGOSClose your eyes and imagine the shape of the country in which you were born. Now imagine the shape of the Nike swoosh. One we call a map, the other we call a logo. But maps can be logos too. Logo is a 1937 word most likely derived from an 1840 word, logogram; a sign or character that represents a word – Logo (words) and gram (that which is drawn). Shapes and letters, points and lines paired with assigned names have been inscribed in our brains throughout our lifetime. Years of repetitive exposure through teachers, textbooks, TV, newspapers, books, magazines, movies, social media, and the internet have bombarded our senses burning images and perceptions into our memory. Companies and governments have spent billions of dollars tp pair particular words with that which is drawn. There’s a reason it’s called branding. These images are emblazoned in your brain, just as a cattle rancher burns an image into the hide of their livestock with a red-hot branding iron. But there’s more to a brand than just the image. Brands are both a symbol, like a word and/or image, that possess a set of associated perceptions. And they are much more difficult to create than a branding iron.I played a small role in building the Microsoft Office brand. You may be more familiar with another set of images I was more closely associated with – icons for Office applications like Word, Excel, and PowerPoint. Because people use, or used, Word, Excel, and/or PowerPoint repeatedly, the image of that icon became increasingly imprinted in their memory. The repeated experience of using those applications gradually formed perceptions associated with the icon. Those perceptions were articulated through the media influencing even those people who never used these applications.Microsoft made more money selling applications as a bundle than individually. So instead of building iconic brands around each product, they created the Office brand. The first Office logo, was a square puzzle of four interlocking pieces filled with red, green, blue, and yellow. It suggested Office was a collection of interlocking pieces. Four independent territories that shared a common border, purpose, and ideal. But getting that Office name and associated puzzle image to become recognized and recalled as readily as say, the Word icon, proved, and still proves, to be a monumental task. Many elements are factored in the forming of perceptions. Some elements the company can control, like the design of the product, marketing materials, and advertising. But others are out of their control like individual needs and desires, societal views, media impressions, and even politics. Politics is where the brand of a country begins. And maps, like flags, can serve as logos. The earliest examples of maps as logos can be found in the imperial maps England produced. They too were puzzle pieces. As Cornell political scientist, Benedict Anderson, wrote in his influential book on nationalism, Imagined Communities:“Its origins were reasonably innocent - the practice of the imperial states of colouring their colonies on maps with an imperial dye. In London's imperial maps, British colonies were usually pink-red, French purple-blue, Dutch yellow-brown, and so on. Dyed this way, each colony. appeared like a detachable piece of a jigsaw puzzle. As this 'jigsaw' effect became normal, each 'piece' could be wholly detached from its geographic context. In its final form all explanatory glosses could be summarily removed: lines of longitude and latitude, place names, signs for rivers, seas, and mountains, neighbours. Pure sign, no longer compass to the world. In this shape, the map entered an infinitely reproducible series, available for transfer to posters, official seals, letterheads, magazine and textbook covers, tablecloths, and hotel walls.” Territory maps have been created for centuries as a way to demarcate territory for the purpose of ownership and dominion. That was as true for monarchies, as it is for nation-states. Over the last couple months I’ve chronicled the evolution and execution of cadastral and topographic maps across America just as Jefferson had envisioned. Around this time, regions around the world were doing the same. Including Thailand.IF YOU CAN’T BEAT ‘EM, JOIN ‘EMIt wasn’t until the middle of the 1800s that Siam, now called Thailand, had a top-down Cartesian style representation of the country and census of its people. Sure they had maps, but they were mostly drawn at eye-level with invented perspectives. Many were dominated by textual des
Winning Over the Windy City with Watercolors
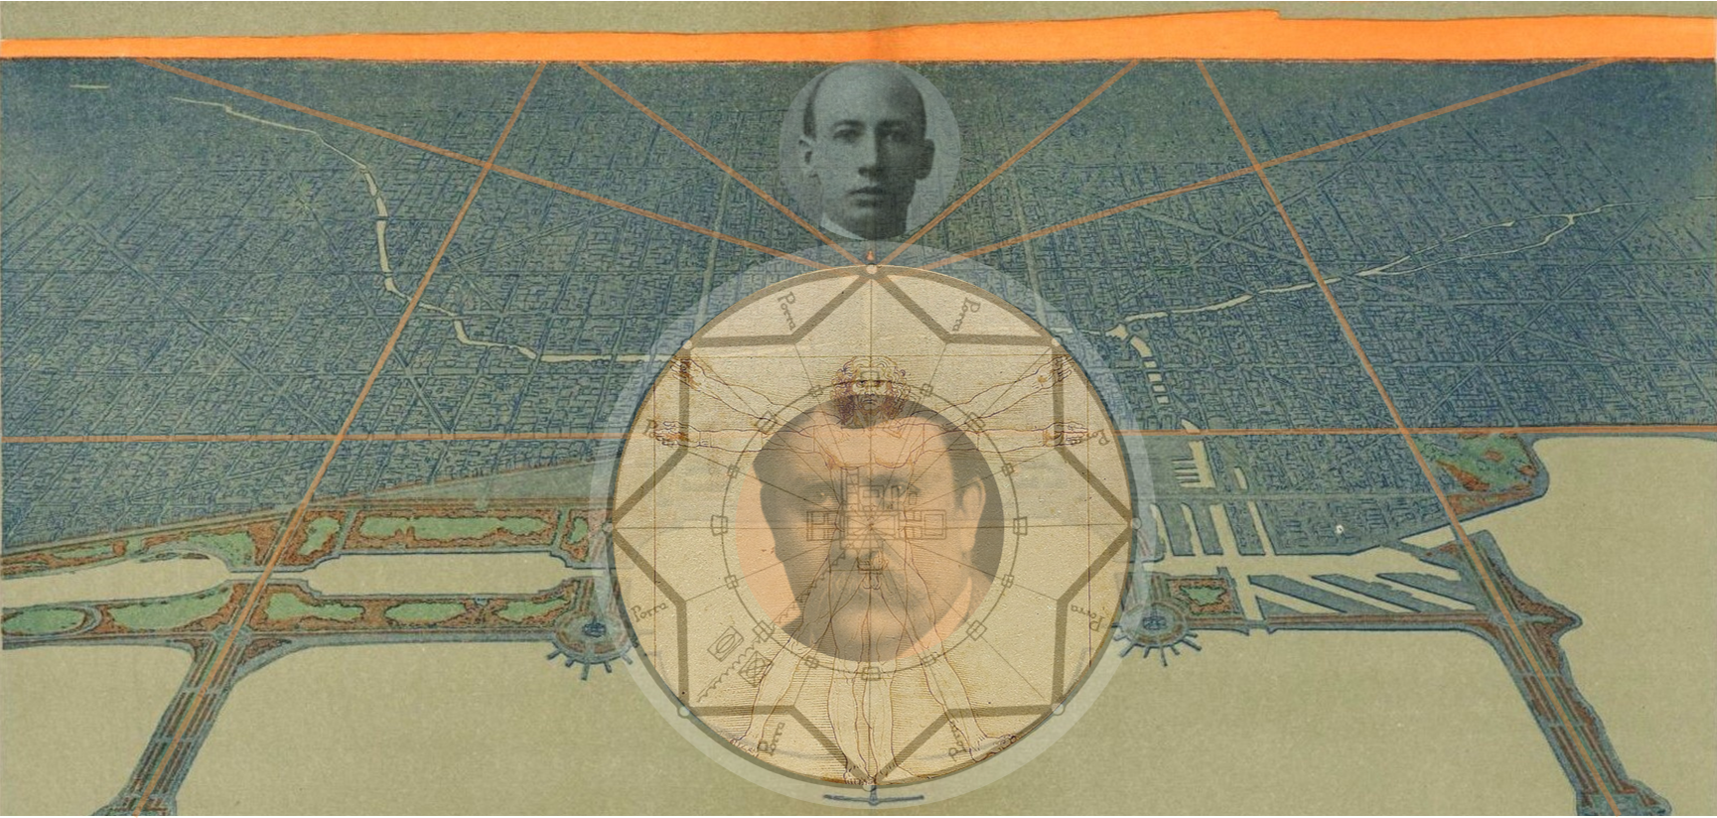
Hello Interactors,Chicago was bursting at the seams at the turn of the century. People were stressed, companies were panicking, and something had to be done. They needed a plan; a map of a 20th century city. They needed someone to draw a picture, ease their minds, and persuade Chicago’s industrial elite. As interactors, you’re special individuals self-selected to be a part of an evolutionary journey. You’re also members of an attentive community so I welcome your participation.Please leave your comments below or email me directly.Now let’s go…THE POWER OF THE PENIt wasn’t going to end well. The mechanical engineering class was split in their opinions over elements of a design for a handle bar bracket they were designing. It was getting tense. There was yelling, pointing, and gesturing among the aggressive ones while distracted, despondent doodlers were dawdling in the margins. The instructor, clearly rattled, was vainly refereeing the melee. Then, from the back of the class, came a calm but firm interjection. “Can I make a suggestion?”, a man’s voice said. The class whirled around in their seats. There was another professor seated in the back, but who was he? Last week we left Chicago at the turn of the century. The flood of immigrants from the 1830s to 1900 had led to exponential population growth. There were nearly 4,000 people living in Chicago in the 1830s and over two million by 1900. It made a lot of people rich, but left many more poor. It was also causing congestion, pollution, and, yes, disillusion. Chicago was not becoming what the city’s elite had imagined. Those who could, escaped to the suburbs proffered. Those who couldn’t, scraped by on whatever was offered. But everyone was frustrated, confused, anxious, and scared. Infamous Chicago organized crime had been building for decades with crooks named Michael ”Hinkey Dink” Kenna, George “Bugs” Moran, and the “Bloody Gennas” – six Sicilian brothers “Bloody” Angelo, Mike “The Devil”, and Pat, Sam, Jim, and Tony – “The Gentlemen.” Railroads were stringing rail lines into the city, boats were crowding the harbors, and the glimmer of automobiles was on the horizon. Companies were booming and competing for rights to increasingly limited public land. The government did their best to mediate and keep the town running, but it was getting heated. Then somebody in the periphery was asked to make a suggestion. As that engineering class was staring down the mysterious man in the back, he continued, “I’m not a mechanical engineer so I’m having trouble understanding what you’re talking about. Would someone kindly draw a picture of this bracket on the whiteboard so I can see what it is you’re arguing about?” All of the students look at each other and then one sheepishly admitted what they were all thinking, “I don’t really know how to draw.” Eventually somebody was delegated to draw a rough sketch of the part. They then circled and labeled the elements they were discussing. The room erupted again in debate. “That’s not what we’re talking about!”, said a boisterous one as they charged the whiteboard. They grabbed another marker and circled and labeled another element. “What are you talking about?”, said another as they leapt from their seat for the board. Soon, all of the students were gathered around the whiteboard, pens in hand, visually negotiating a resolution. With the power of the pen, and the emergence of an image, comes the persuasion of people. To visualize is to compromise.THE WINDY WHITE CITYSeven years before the 20th century arrived, Chicago hosted the 1892 World’s Fair: Columbian Exposition. Otherwise known as the Chicago World’s Fair. But most people ended up calling it ‘White City’ due to the white neoclassical architecture it featured, but in today’s social context it was ‘White’ for other reasons. For one, it was celebrating the 400 year anniversary of Christopher Columbus “discovering” America. For another, the organizing committee refused to appoint any Black or African-American members. There were Black and African-American exhibits accepted as a consolation, but even though these Americans comprised one tenth of the population at the time, it seemed the organizing committee would rather not hear from them.Ida B. Wells, a Chicago resident at the time, Frederick Douglass, and Irvine Garland Penn didn’t sit idly by. They produced a pamphlet entitled, The Reason Why: The Colored American is not in the World's Columbian Exposition. It was printed in English, French, and German. The preface reads like this:“TO THE SEEKER AFTER TRUTH:Columbia has bidden the civilized world to join with her in celebrating the four-hundredth anniversary of the discovery of America, and the invitation has been accepted. At Jackson Park are displayed exhibits of her natural resources, and her progress in the arts and sciences, but that which would best illustrate her moral grandeur has been ignored.The exhibit of the progress made by a race in 25 years of freedom as aga
Boomtown Maps
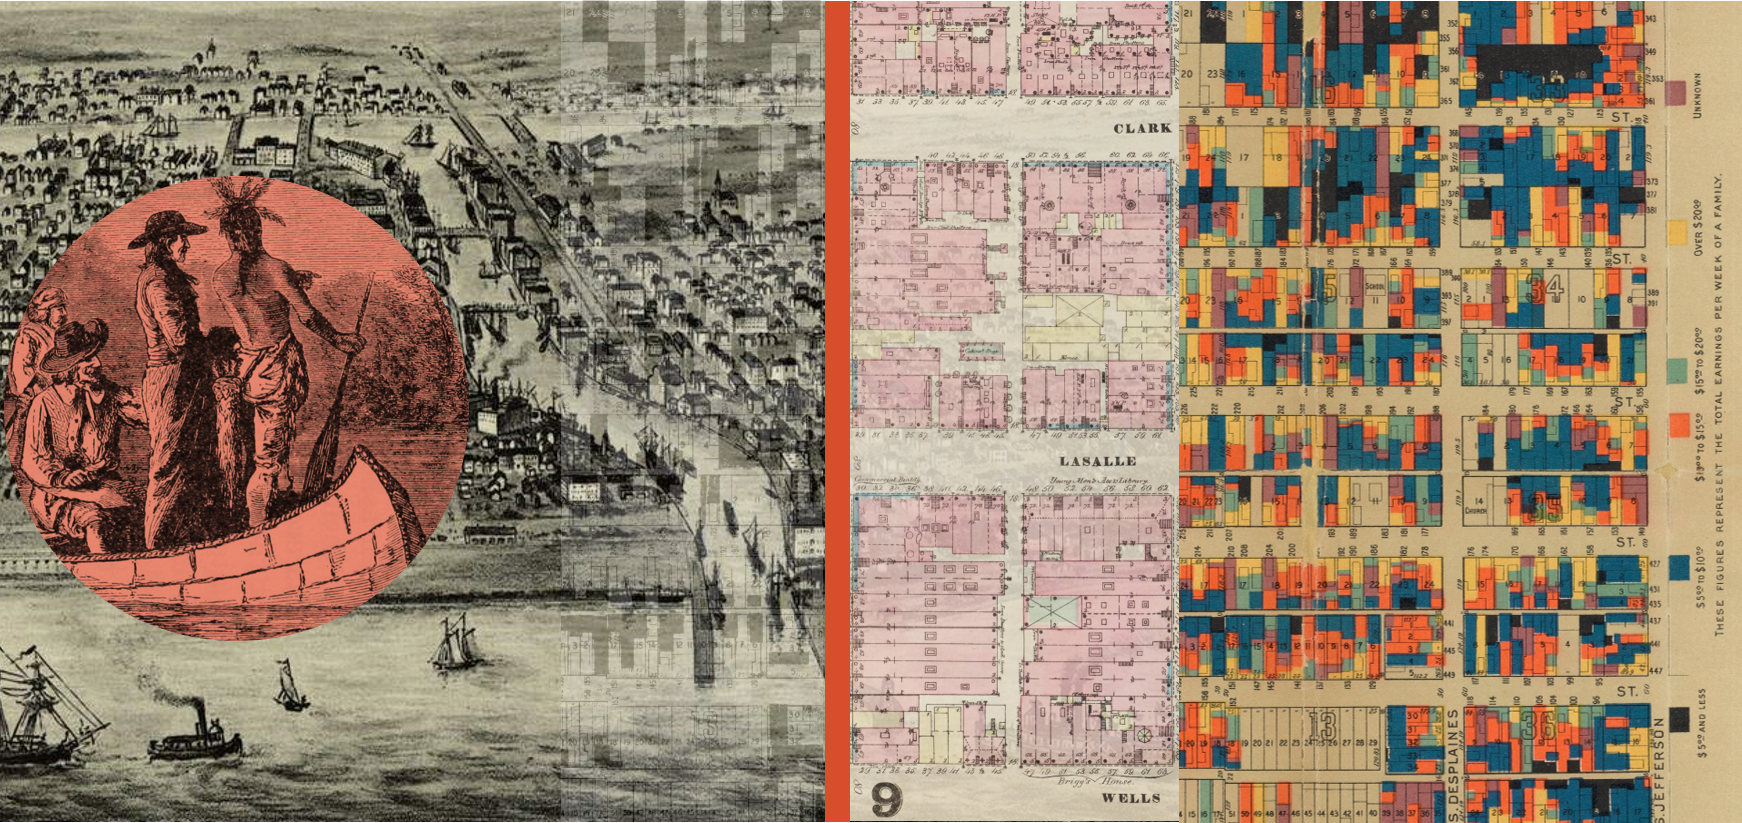
Hello Interactors,So far this spring I’ve chronicled the spread of cadastral mapping across America. It was all part of Jefferson’s gridded agrarian vision. But by the middle of the 1800s immigrants started flooding in, the industrial age was taking hold, and cities were the thing to map.As interactors, you’re special individuals self-selected to be a part of an evolutionary journey. You’re also members of an attentive community so I welcome your participation.Please leave your comments below or email me directly.Now let’s go…THE PREACH AND THE LEECH "This lake was well named; it was but a scum of liquid mud, a foot or more deep, over which our boats were slid, not floated over, men wading each side without firm footing, but often sinking deep into this filthy mire, filled with bloodsuckers, which attached themselves in quantities to their legs. Three days were consumed in passing through this sinkhole of only one or two miles in length."Those are the words of Gurdon S. Hubbard, a fur trader from Vermont. In 1816, at age 18, he begged his parents to leave his job at a local hardware store to join a buddy on a fur trading expedition to Mackinac Island, Michigan. Two years later, in 1818, he found himself on a boat being drug through leech infested mud next the aptly named, Mud Lake – a terminating branch of the Des Plaines river. He was traversing a well known shortcut to Lake Michigan. As his men pulled blood sucking predatory leeches from their legs, he likely would have also been breathing in the odors of a pungent leek that grew along those shores. The Algonquin people called them Checagou. By the time Hubbard found this shortcut, it had already been named Chicago Portage and had been used for over one hundred years. In 1673, French Jesuit priest Jacques Marquette joined French Canadian Louis Jolliet to map the Mississippi river. As they were paddling their way upstream on their return to the Great Lakes, they encountered a Miami tribe by the shore. The Miami tipped them off to a shortcut to Canada. Instead of paddling all the way up to Lake Superior, they told them they could hang a right at the Illinois River and head north through Lake Michigan instead. The Illinois River becomes the Des Plaines River at what is now Joliet, Illinois. The river then opened to an estuary later dubbed Mud Lake near present day Lyons, Illinois – a suburb of Chicago. Thus began a days long slog tugging a boat made from birch logs; a portage to Lake Michigan and beyond.Plodding their way to the mouth of the great lake on the horizon, Jolliet got to thinking about all the fur he could trade now that he knew this shortcut. After all, this portage connected two pivotal North American transportation routes – the Great Lakes and the Mississippi River. In his journal he wrote, “We could easily sail a ship to Florida…All that needs to be done is to dig a canal through but half a league of prairie from the lower end of Lake Michigan to the River of St. Louis [today’s Illinois River].”Jolliet and Marquette spread the word and soon many others were trading through the Chicago Portage. The first to settle was Jean Baptiste Point du Sable and his wife Kitihawa in the 1780s. Jean Baptiste was of French and African descent and Kitihawa was from the local Potawatomi tribe. They were married ceremoniously among her people in the 1770s and then, having converted to Catholicism, were married in 1788 in Cahokia, Illinois in a Catholic ceremony. They, and their two children, went on to build a successful farm and trading post in a well appointed log cabin. They are considered the founders of what we now call the city of Chicago. Jean Baptiste died the year Gurdon Hubbard and his leech bitten crew showed up in 1818.GRID AS YOU GROWThat same year the Illinois General Assembly was formed, the young state’s first government. Hubbard settled in Chicago and eventually became a legislator. He lobbied tirelessly for supplemental funding from the Federal government to build a canal that would replace the pernicious Chicago Portage. It worked. They broke ground with Hubbard wielding the spade, in 1836. By this time Hubbard had also started Chicago’s first stockyard and meat packing plant. He knew, just as Jolliet did over one hundred years before, that Chicago was destined to be an attractive port town; a symbol of growth and prosperity. But neither could have imagined what happened next. It’s hard to believe today.When Hubbard broke ground on the canal, the population was around 4,000 people. Ten years later, in 1850, that number grew nearly eight-fold to 30,000 people. By 1886, around the time Hubbard was buried just north of Chicago at Graceland Cemetery, there were nearly one-million people living in Chicago. Immigrant populations were flooding the city for work, many as laborers on the canal. Land prices were skyrocketing. “In 1832, a small lot on Clark Street sold for $100. Two years later, the same property sold for $3,000. And a year after that,
The U.S. Census: Mapping a Sense of Us
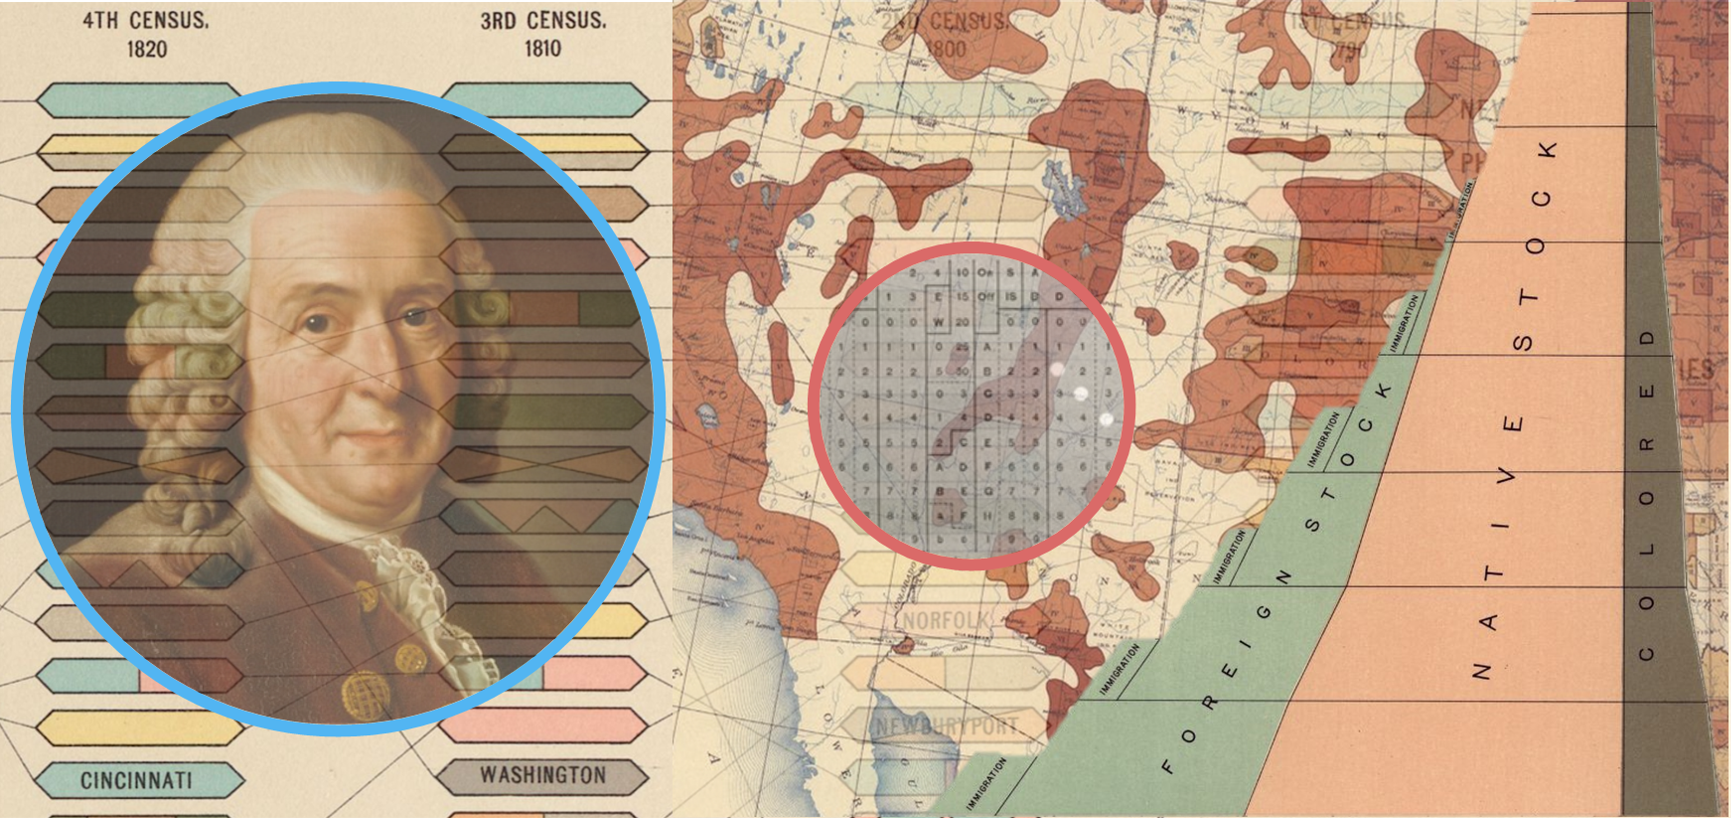
Hello Interactors,We’re learning every day just how embedded racism is in the workings of American polity. My recent posts have picked on the history and influence of America’s cadastral and topographic cartography. Today I weave together European scientific determinism, early ‘big data’ authoritarianism, and White supremist cartography.As interactors, you’re special individuals self-selected to be a part of an evolutionary journey. You’re also members of an attentive community so I welcome your participation.Please leave your comments below or email me directly.Now let’s go…CARL IN ALBUS PHYSICUS (CARL THE WHITE SCIENTIST) Our world is filled with data. There’s so much data that we came up with huge word to describe it – Big. Ok, a three letter word that happens means a lot. ‘Big Data’ is a big deal these days. We can’t seem to ever get enough data. More data seems to be more better. Scientists have been collecting, categorizing, and classifying data for hundreds of years. It’s the basis of the scientific method and our appetite for more data doesn’t seem to be waning. One of the most influential scientists in the early days of systematic data collection and classification was the father of taxonomy, Carl von Linné. He wrote in Latin, so he liked to go by Carolus Linnaeus. The word taxonomy has Greek origins: taxis (arrange) nomia (method). The method of arranging. Not to be confused with taxidermy. That’s the arrangement of skin. Linneaus was a Swedish botanist, zoologist, and taxonomist who wrote a very popular book called Systema Naturae. The first edition came out in 1735, but the one that really caught steam and spread around the world was the tenth edition in 1758. That was the one where he dedicated five of the over two thousand pages to the following taxonomy of homo sapiens:* Homo americanus* Homo europaeus * Homo asiaticus * Homo africanus As you can see, he assigned a geographic association to each name: America, Europe, Asia, and Africa. It was commonly believed by Christian scientists during these times that humans were shaped by God to fit in their environment; including the shape of their bodies, color of their skin, behavior, and how they governed themselves. As Linneaus often said, "God created, Linnaeus organized." Brad observes that Carl also spoke in the third person. Here’s how he organized and described God’s homo sapiens indigenous to their land: “Americanus: Red, choleric and straight. Straight, black and thick hair; gaping nostrils; [freckled] face; beardless chin. Unyielding, cheerful, free. Paints himself in a maze of red lines. Governed by customary right.Europaeus: White, sanguine, muscular. Plenty of yellow hair; blue eyes. Light, wise, inventor. Protected by tight clothing. Governed by rites.Asiaticus: Sallow, melancholic, stiff. Blackish hair, dark eyes. Stern, haughty, greedy. Protected by loose garments. Governed by opinions.Africanus: Black, phlegmatic, lazy. Dark hair, with many twisting braids; silky skin; flat nose; swollen lips; Women [with] elongated labia; breasts lactating profusely. Sly, sluggish, neglectful. Anoints himself with fat. Governed by choice [caprice].”Linneaus ended up printing thirty editions of Systema Naturae all the way up to 1793. His geographically assigned taxonomy of humans became the defining standard of how the world came to categorize people. The word used to describe the taxonomy of the physical and behavioral characteristics Linneaus assigned to homo sapiens dates all the way back to the 1500s. That word is ‘race’. BIG DATA, BIG COUNTRY, BIG MAPS, BIG PROBLEMGiven the geographic binding to race, it should come as no surprise that cartographers in Europe and America were quick to map these races. I spent the month of April talking about the history of America’s survey system and the gridding of the land for purposes of taxation and White colonial settlement. It started with Jefferson’s Land Ordinance act of 1785. But another American survey was started in 1790 that has also resulted in the creation of maps. It’s even written into the U.S. Constitution. It’s the census survey. Just as America was the first to yank large scale cadastral mapping out of Roman times to build an empire, the U.S. was the first to utilize the census to reapportion government representation as the population grew. The U.S. House of Representatives grew steadily more or less in a straight line from the first census in 1790 to just before 1920. It’s been flat ever since. Despite the fact our population has more than tripled since then. I know big government is very popular these days, but clearly we’re not all duly represented in Washington D.C.Nineteen-twenty also marked the year the sagging line of rural dwellers crossed the climbing line of urban dwellers. Today over eighty percent of the U.S. population lives in urban areas and that number is expected to grow exponentially. Another surge in U.S. population occurred in the mid 1800s as land across the country beca
You Are What You Map
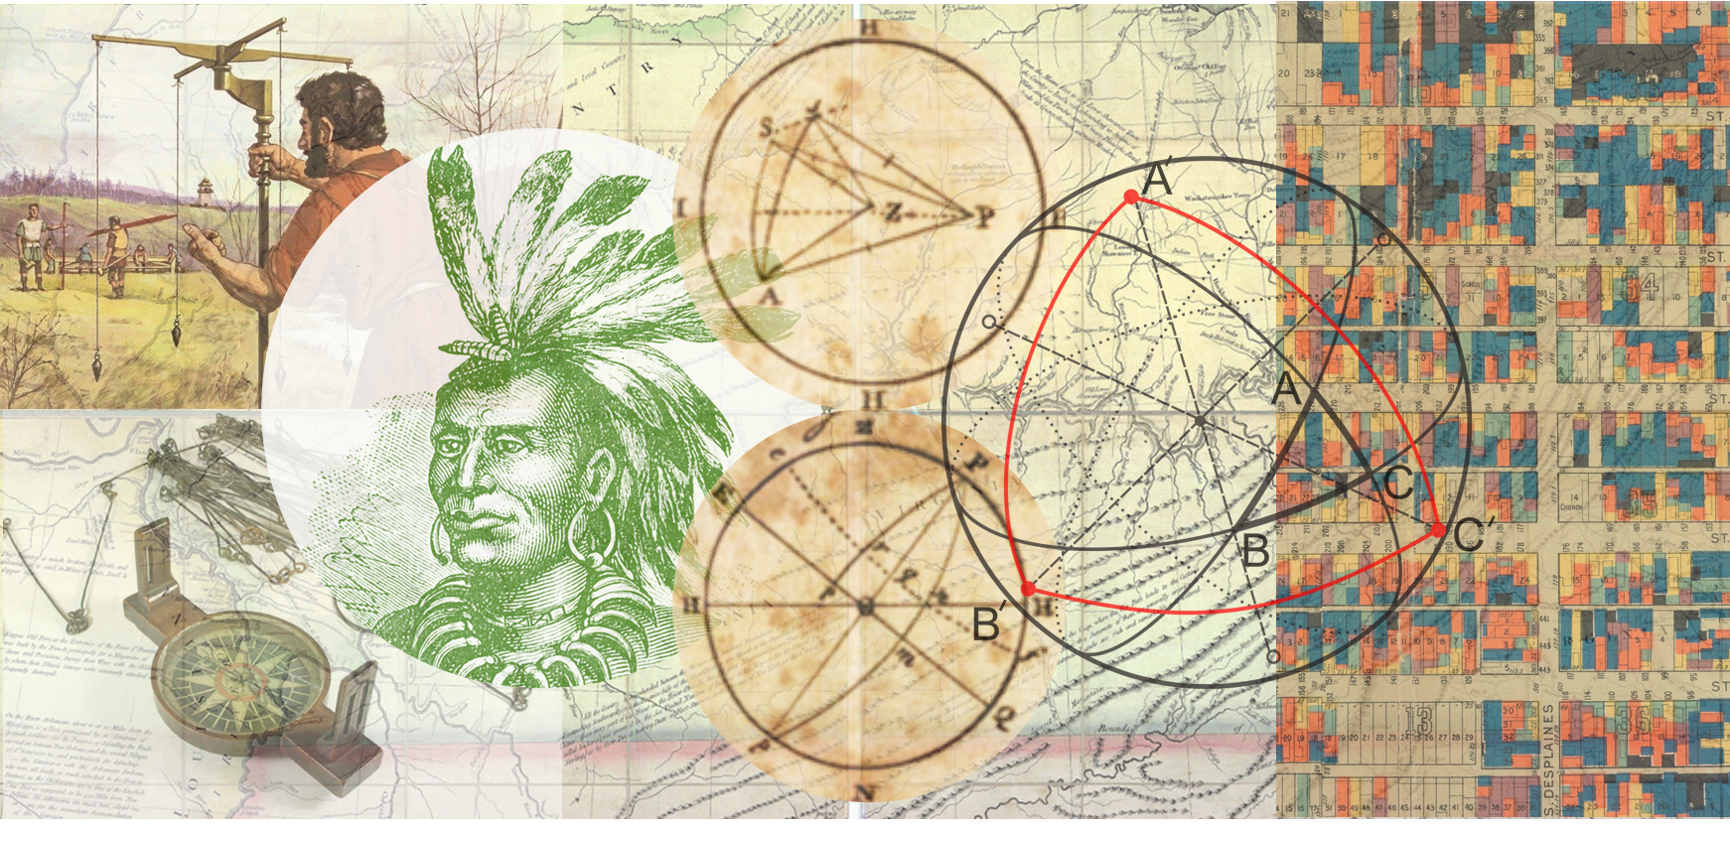
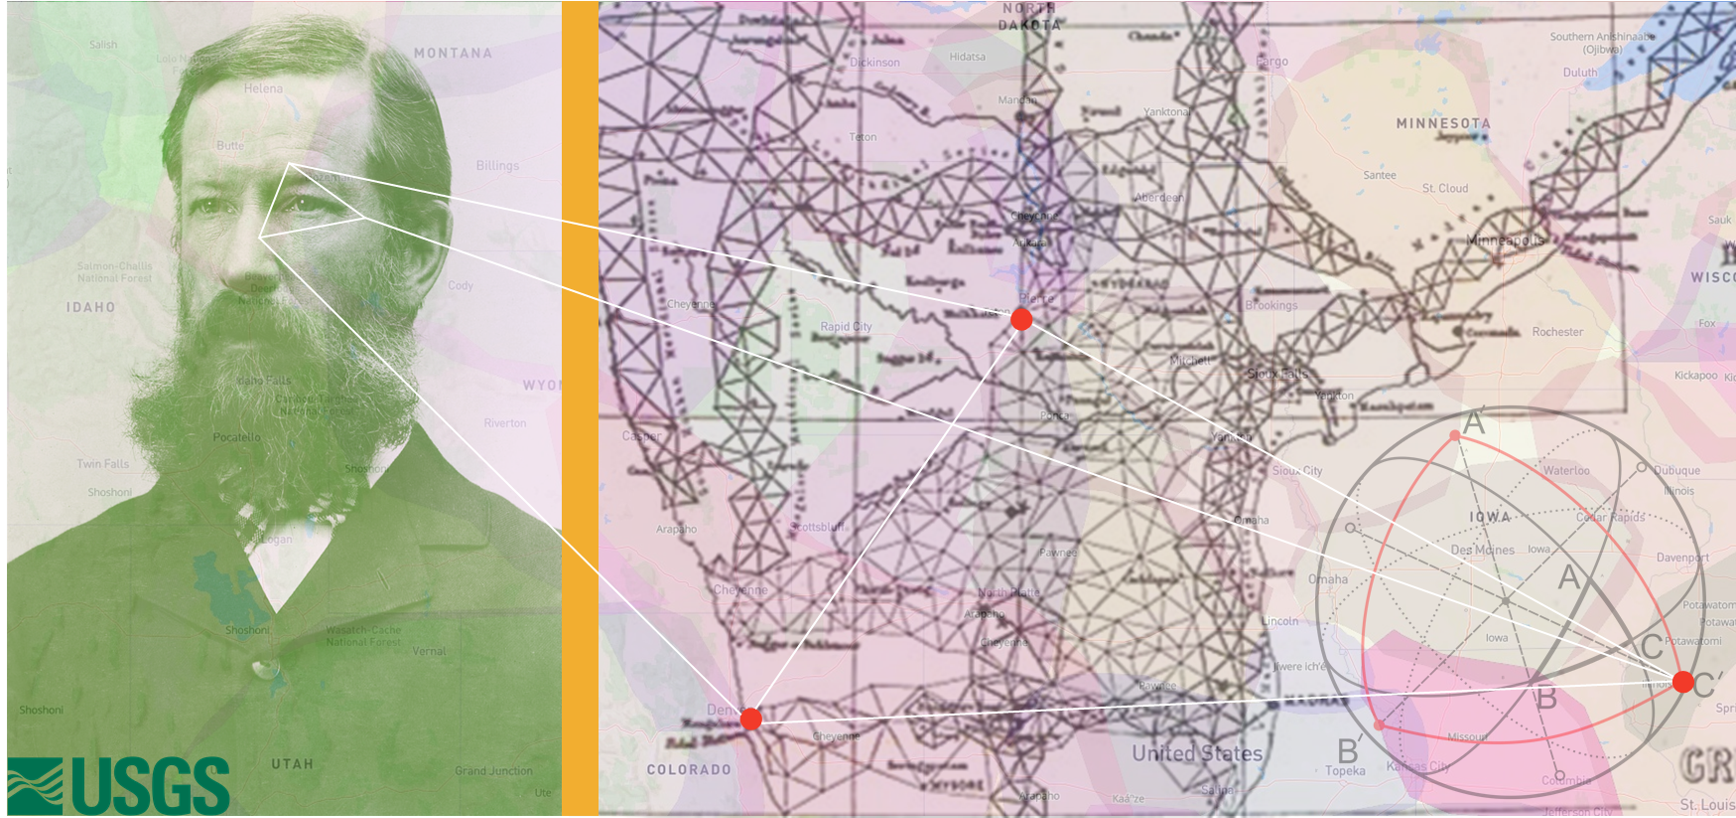
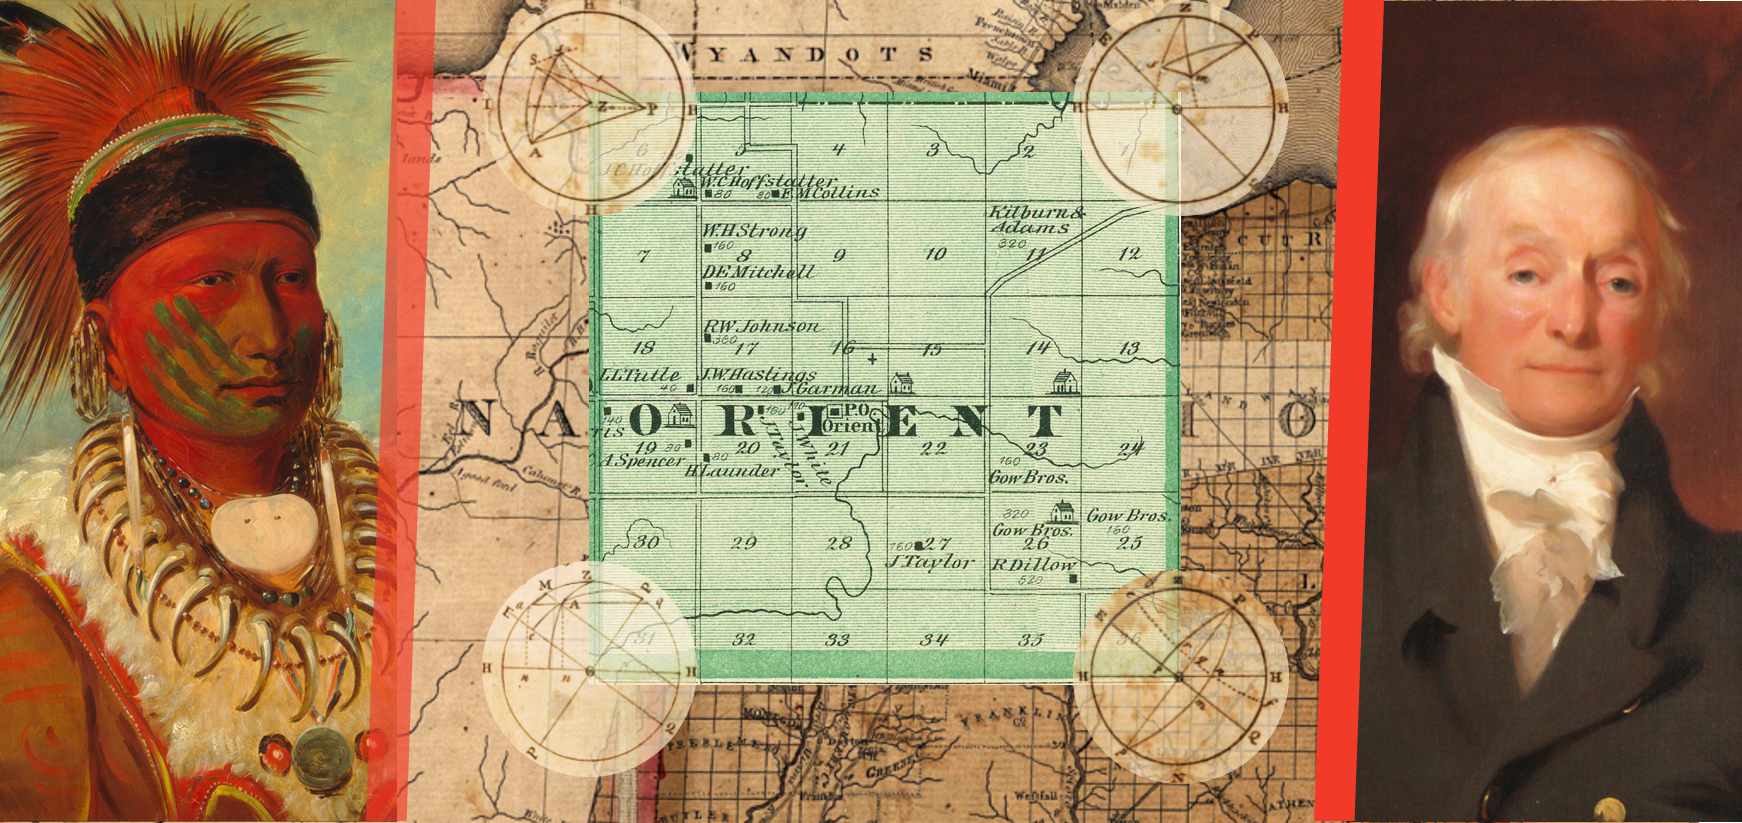
Hello Interactors,Today we’re branching into topography and the role western colonial expansion plays in the creation and articulation of our naturally occurring geography. Most of us are not very skilled at critiquing the role maps have played in shaping how we see the globe and the people on it. But I’m optimistic that when we do we can better confront the boundaries that maps have created between people and place.As interactors, you’re special individuals self-selected to be a part of an evolutionary journey. You’re also members of an attentive community so I welcome your participation.Please leave your comments below or email me directly.Now let’s go…NAME THAT PLACEI spent last April talking about how the United States was surveyed and diced in little squares that are featured in our maps today. It was a technique ripped out of ancient Rome as a way to rationally quantify space across massive swaths of land. The United States perfected gridded cartesian cadastral cartography, but drawing little lines on paper as a means of assessing, assuming, and asserting control over land had been done for centuries by European colonial settlers around the world – beginning in the Renaissance. The Renaissance accelerated mapping. This was an era of discovering new knowledge, instrumentation, and the measuring and quantification of the natural world. Mercator’s projection stemmed from the invention of perspective; a word derived from the Latin word perspicere – “to see through.” European colonial maps were drawn mostly to navigate, control, and dominate land – and its human occupants. We have all been controlled by these maps in one way or other and we still are. Our knowledge of the world largely stems from the same perspective Mercator was offering up centuries ago. The entire world sees the world through the eyes of Western explorers, conquerors, and cartographers. That includes elements of maps as simple as place names. Take place names in Africa, as an example. The country occupied by France until 1960, Niger, comes from the Latin word for “shining black”. Its derogatory adaptation by the British added another ‘g’ making a word we now call the n-word. But niger was not the most popular Latin word used to describe people of Africa, it was an ancient Greek derivative; Aethiops – which means “burn face”. If you replace the ‘s’ at the end with the ‘a’ from the beginning, you see where the name Ethiopia comes from. Even the name of my home state of Iowa has dubious origins. Sure it’s named after the Indigenous tribe, the Iowa or Ioway, but the Iowa people did not call themselves that. They referred to themselves in their own language as the Báxoje (Bah-Kho-Je). They settled primarily in the eastern and south eastern part of the land we now call Iowa. Most of them were forced to relocate to reservations in Kansas and Oklahoma. It’s believed the name Iowa, came from a Sioux word – ayuhwa which means “sleepy ones.” It would be like the south winning the Civil War and then turning around and declaring the region to their north henceforth be referred to as: Yankees. Even the word Sioux is a French cheapening of a word from the Ojbiwe people– Nadouessioux (na·towe·ssiw). The Sioux were actually a nation combined of the Dakota, Lakota, and Nakota people. They referred to themselves as Oceti Sakowin (oh-CHEH-tee SHAW-kow-we) or “Seven Council Fires”. They covered the sweeping plains of most of what we now call Minnesota; which stems from the Dakota phrase Mni Sota Makoce – “where the waters reflect the sky”. They extended south to the northwest corner of so-called Iowa and east to the more aptly named state of South Dakota. These people were expelled from Minnesota after the Dakota War of 1862. They continue to suffer today the pains felt by America’s largest mass execution in history at the hands of none other than Abraham Lincoln. Just months after signing the Emancipation Proclamation, Lincoln ordered 38 Dakota and Lakota men to be hung. Dissatisfied with the pace and politics of the makeshift trial of 303 Indigenous people, he decided on his own who should live and who should die. On April 23rd, 1863 the United States declared their treaties with the Lakota and Dakota null and void, closed their reservations, and marched them off their land. It took until this year, 2021, for the United States to give a southern sliver of land back to them. And in Northern Minnesota they’re still fighting to protect the water that reflects the sky.MAPS AND MATH FROM A MAN FROM BATH There’s another Westernized place name just west of where the Dakota and Lakota people thrived called Gannett Peak. It’s the tallest mountain in the state of Wyoming and is part of the Bridger-Teton range. I’m sure you’ve heard of the more popular neighboring range, the Grand Teton’s; another notable (and sexist) French place name which means – ‘Big Boobs’. Gannett Peak is named after Henry Gannett – the father of American mapmaking. Born in Bath, Maine in 1846
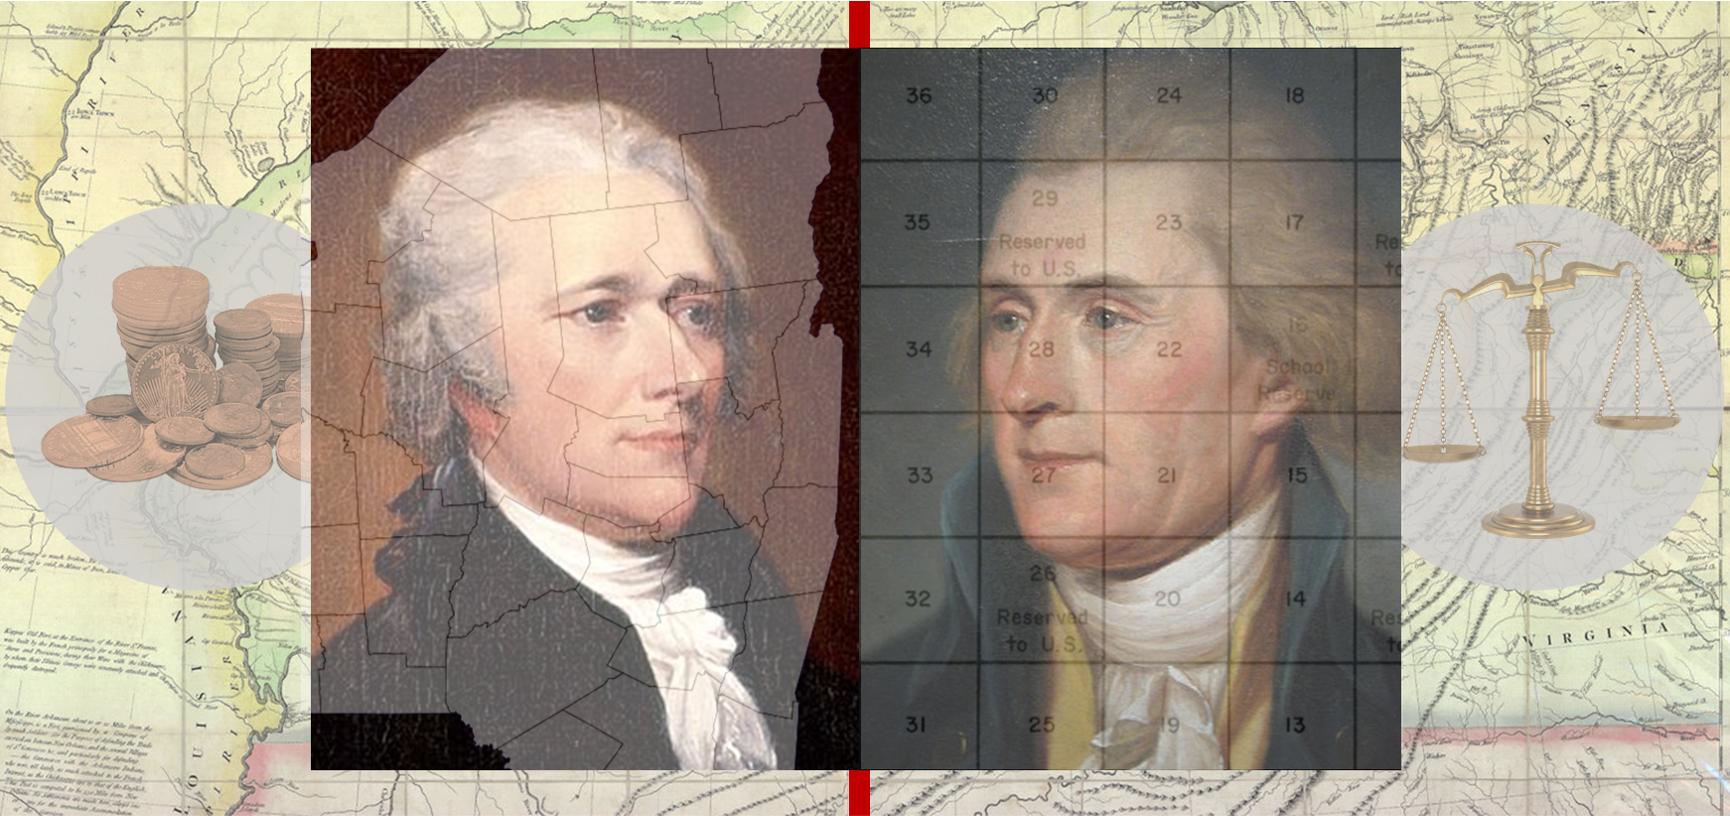
Make Your Own Survey in Under a Day
Hello Interactors,Today I’m wrapping up this April series on the role large scale surveying played in determining how people of the United States of America interact with each other and the government. Jefferson had a vision for the country that combined his desire for agrarian expansion west, tax revenue for building a world dominating military, and his fascination with astronomical, nautical, and terrestrial mapping.As interactors, you’re special individuals self-selected to be a part of an evolutionary journey. You’re also members of an attentive community so I welcome your participation.Please leave your comments below or email me directly.Now let’s go…PLUNDER THE BLUNDERERThe 2020 United States Presidential election had its fair share of electoral college drama, but nothing like the election of 1800. Thomas Jefferson was running against the incumbent John Adams to become the first non-Federalist President. It ended in an electoral college tie. To make matters worse, a flaw in the Constitution meant the run-off was between the top two vote getters. Back then, voters could vote for both the position of President and Vice President independently. Jefferson and his Vice Presidential candidate, Aaron Burr, each tied with 73 electoral college votes. Adams only had 65 and his running mate 64. The decision on who should be president, Jefferson or Burr, fell to the House of Representatives. Hamilton, a Federalist and no friend of Jefferson, detested Burr even more and lobbied in the background with other Federalist representatives to elect Jefferson. It worked. Jefferson became the United States’ third president and the first Democratic-Republican in February of 1801. Two years later, in 1803, Jefferson turned his attention toward another Federalist – the Surveyor General, Rufus Putnam. I mentioned Putnam in last week’s post when he became the United States’ first Surveyor General in 1796. He was appointed by George Washington under whom he served as Colonel and Chief Engineer in the Revolutionary war. He was also the founder of the Ohio Company of Associates – the ‘associates’ were his Revolutionary War buddies. The land he was asked to survey was the very land from which his company would profit. Jefferson, the mastermind behind the methodical gridding of land for taxation and expansion, wasn’t happy with Putnam’s work. He felt the surveys were rushed, inexact, and that Putnam was passed his prime. At 64 years old, Jefferson found Putnam to be too “set in his ways”. It was time for a new Survey General. Jefferson’s feelings for Putnam are clear in his offer letter to his replacement:“SirYou will be sensible of the reasons why the subject of this letter is desired to be entirely confidential for a time. Mr. Putnam the present Surveyor General in the Northern quarter is totally incompetent to the office he holds. …it has cost Congress a great deal of time…and the removal of the blunderer has been sorely and generally desired……I am happy in possessing satisfactory proof of your being entirely master of this subject, and therefore in proposing to you to undertake the office…it is important to have an immediate change or we shall have the same blunders continued.” Putnam’s replacement would be Jared Mansfield. He was just the man Jefferson needed. Mansfield was a mathematician who was skilled at using astronomy to perfect his surveying. He attended Yale in 1773, but after the death of his father became delinquent. He was accused of stealing books from the Yale library and was expelled. He landed a series of teaching jobs at small grammar schools in Connecticut, but was welcomed back to Yale. In 1787 he was awarded his degree with his original classmates. In 1801 Mansfield published what may be the first piece of original mathematical research from an American in a collection of essays entitled, Mathematical and Physical. It covered topics in algebra, geometry, Newtonian fluxions, and nautical astronomy. The paper caught Jefferson’s attention and he appointed Mansfield to be Professor of Mathematics at West Point Military Academy. Two years later, in July of 1803, he became Surveyor General replacing the ‘blunderer’ Rufus Putnam.MANSFEILD, MEIGS, AND TIFFIN’S TENSIONFinally Jefferson had a surveyor he could trust. Mansfield set out from New Haven, Connecticut to Marietta, Ohio with a plan. While he knew it was impossible to correct all the errors of previous surveys, he was clear that moving forward all surveys had to be conducted as he instructed. Given his position of Surveyor General also came with the title of Army Lieutenant Colonel, he was in a position to make demands. Eight months later the Congressional Act of March 26, 1804 came into effect. This was not only the first act passed under the direction of Mansfield, but it granted him authority to extend surveying into new territories in “which Indian title had been extinguished or" shall hereafter be extinguished.” (1) It was clear the U.S. Government was i
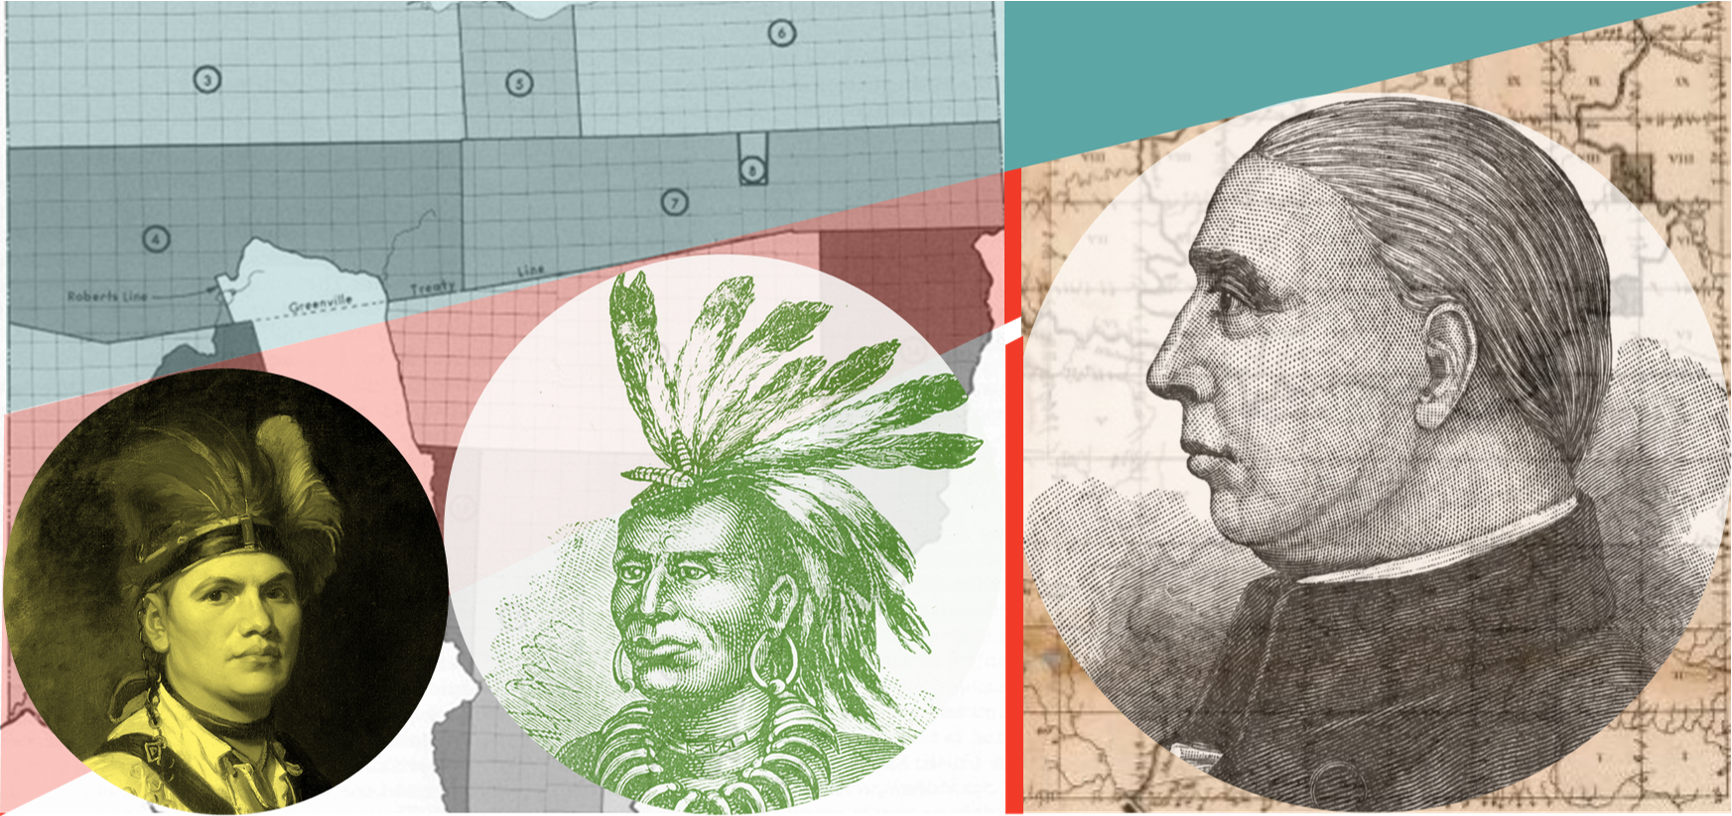
Guns, God, and Gold
Hello Interactors,Welcome to the third in a series on the role surveying and cartography played in the establishment of the United States. Today we continue further west into Ohio in the lead up to the 1800s. The U.S. government needed money to fulfill their dreams of being a global superpower. And it all hinged on Jefferson’s plan to extract money from neatly surveyed squares of land occupied by sovereign Indigenous nations who had been here for thousands of years. They were not going to give easily and they never will.As interactors, you’re special individuals self-selected to be a part of an evolutionary journey. You’re also members of an attentive community so I welcome your participation.Please leave your comments below or email me directly.Now let’s go…THE SEVEN RANGES RAGE ON“Regulating the grants of land appropriated for Military Services, and for the Society of the Brethren, for propagating the Gospel among the Heathen.”This is the title of the Land Act of 1796. It was enacted on June 1 of that year, nearly a decade after the United States’ chief Geographer, surveyor, and mapmaker, Thomas Hutchins, had died after surveying the Seven Ranges just west of the Ohio River. The gridding and partitioning of land further west into Ohio continued to progress. The decade leading up to the Land Act was filled with increased Indigenous resistance, botched surveys by scandalous land speculators, and an eager and anxious government who needed money for their military and land from the ‘heathens’. The Seven Ranges did not produce the kind of revenue Congress had anticipated. It was risky business for individual settlers to forge into territories of unhappy native occupants who had no allegiance to Thomas Jefferson’s cartesian adherence. The government was offering land to colonizers for cheap, at one dollar per acre, but you risked your life squatting on land unprotected from Indigenous land and water protectors. So many colonizers just waited for land speculators to buy the land so they could buy it at a discounted price – plus interest. Settlers also had to pay for the survey that proved to the government and their neighbors that it was ‘their’ land. This meant the surveys mapping their plats and townships were sloppily produced or not made at all. Sometimes land companies would provide squatters security and protection from violence they may encounter. But it was rare. Tribal nations in this area were accustom to dealing with invaders. They had a history of negotiating with both the English and the French prior to the Revolutionary War. The French needed Indigenous allies given they were outnumbered by the British colonizers. At the beginning of the French and Indian War, in 1754, there were nearly two million in the British colonies and only 60,000 among the French colonies. The Indigenous nations would sometimes pit the English and French against each other in hopes of securing and maintaining land for themselves. After the Revolutionary War, there was a third country vying for Indigenous land, the United States. The fight for land with this nation by Indigenous nations continues to this day. You can read more about the Land Back movement and it’s importance to future healthy interactions of people and place here.A FOOLING OF HARD KNOXRecall from a previous post that it was the end of the French and Indian War, in 1763, that Thomas Hutchins was working for the British army. He was surveying and securing land along the Ohio River for the British and allied Indigenous nations. Twenty one years later, in 1781, Hutchins became the chief Geographer for the United States helping Jefferson with the details of the Land Ordinance of 1784. The original plan for the dicing up of American land. And now, after platting the Seven Ranges and Hutchins’ passing in 1789, the Ohio surveying experiment had been overrun by land speculators, squatting settlers, and angered Native nations. But these fierce, proud, intelligent Indigenous nations were once again ready to negotiate alliances with the global super-powers. Including upstarts like the United States.By this time political and military negotiations were led by a White Mohawk leader, Joseph Brant. Brant was born in Ohio to parents that had been raised with the Iroquois in the New York area. He grew up in a multi-cultural world among settling French, Irish, German, English, and his Mohawk people. He was able to speak all the dialects of the Haudenosaunee Confederacy and was educated in 1761 at what was to become Dartmouth College. He rose into leadership positions both within his Mohawk tribe and the British Army and was feared by the United States due to his ability to negotiate with the British and the French. He was also a skilled warrior unafraid to fight for the rights of the people he and his parents grew up with. A fight that had already begun. The Northwest American War, also known as the Ohio War, began the year Hutchins’ set out to survey the Seven Ranges in 1785.
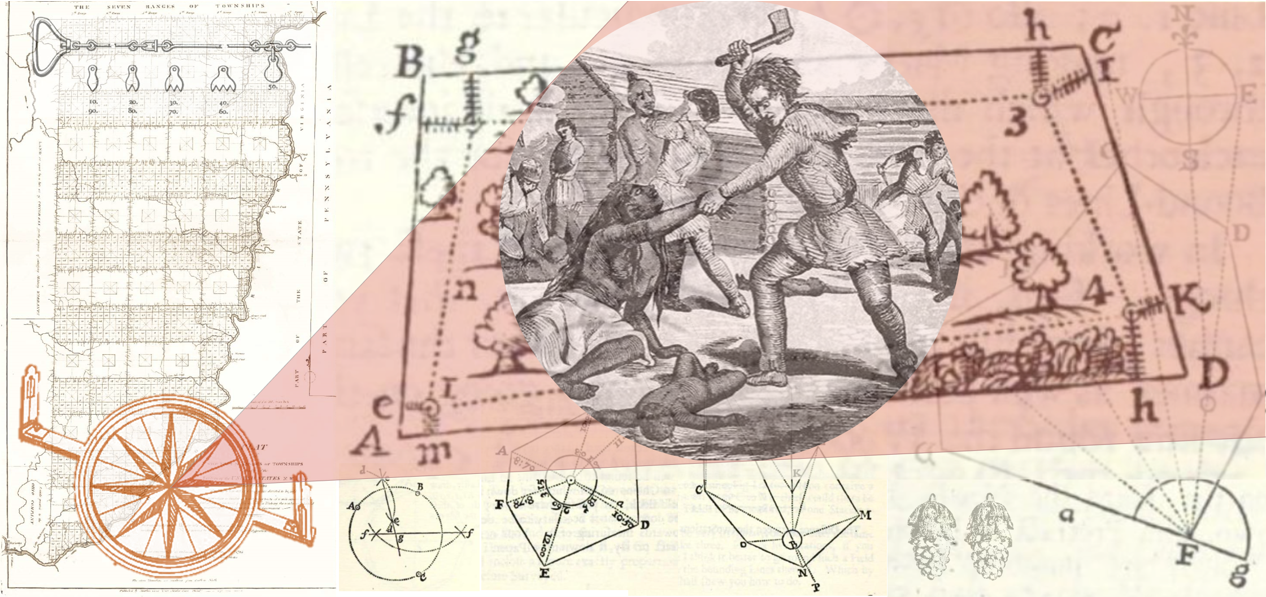
Miami Priced, Ohio Diced
Hello Interactors,This week we continue to explore how maps played a major role in the shaping of America. Thomas Jefferson had a vision of a neatly portioned empire, just as the globe was neatly partitioned into a grid of latitude and longitude lines. Sure he wanted land for farmers, but he also needed to extract property tax revenue to fill the newly formed government’s coffers that had been emptied by the Revolutionary war.The task of surveying and mapping fell on the shoulders of America’s first and only chief Geographer, Thomas Hutchins. Like most things in colonial America, it wasn’t easy.As interactors, you’re special individuals self-selected to be a part of an evolutionary journey. You’re also members of an attentive community so I welcome your participation.Please leave your comments below or feel free to email me directly.Now let’s go…A BUNCH OF GRAPESWhile Thomas Jefferson had grown accustom to the precision of his celestial and nautical instruments, surveying in the rugged American terrain was far from precise. The United States’ first official Geographer, Thomas Hutchins, was venturing into thick woods, mud bogs, and colonies of angry, disenfranchised inhabitants. And his motley crew of eight, out of the planned 13, may not have helped. It was an inauspicious start to Jefferson’s cartographic carving up of a countryside into covenants made of cunningly crafted cartesian corners. Meanwhile, George Washington’s war buddies wanted in on the land Hutchins was about to map out.Hutchins and his men gathered in Pittsburgh in September of 1785 to head west for the Ohio River. As the first government organized and funded survey of public land, they were to map a grid of townships along the Ohio River known as the Seven Ranges. Of the eight men who showed up most were sent by wealthy prospectors, including founders of what was to become a few months later, the Ohio Company. This organization was loosely formed in Boston at the Bunch-of-Grapes tavern by a group of high ranking Revolutionary war veterans. This was more than a tavern. Bunch-of-Grapes was where power-broker backroom deals were made, slaves were traded, and land grabs were orchestrated. These men devised a scheme that would award them land in Ohio. They wrote it up and sent it off to the Confederation Congress who then granted them five percent of the southeastern corner of what was to become the state of Ohio. Many of the men assigned to Hutchins were scouts for these land speculators. They weren’t interested in Jefferson’s plan to modernize and subdivide the country for the purpose of taxation, farming, and community building. Only one of the eight was truly qualified to survey alongside the experienced and capable Hutchins. The following list are the eight of 13 delegates originally intended to represent all of the colonies:* Edward Dowse: New Hampshire. He actually wasn’t from New Hampshire, but Massachusetts. After the Revolutionary war he was involved in the East India Company and Chinese trade. He later served as a U.S. Representative. * Benjamin Tupper: Massachusetts. This state first appointed Rufus Putnam. Putnam is one of the founders of the Ohio Company. He declined because he had recently accepted the position of Surveyor General for lands in what was to become the state of Maine. Putnam requested that Tupper go in his place. It’s believed Tupper was mostly a scout for the Ohio Company. * Isaac Sherman: Connecticut. This post was initially offered to Samuel Parsons, another co-founder of the Ohio Company. So Parsons suggested Sherman. Isaac was the son of a founding father you’ve never heard of, Roger Sherman. He was an attorney about the same age as Benjamin Franklin and the only one to have signed Continental Association, the Declaration of Independence, the Articles of Confederation, and the Constitution. Roger had just become the first mayor of New Haven, Connecticut, supported Jefferson’s idea of government acquired land as a revenue source, and was keen to settle the Connecticut Western Reserve – a block of land in what is now eastern Ohio. * Absalom Martin: New Jersey. Martin indeed was a surveyor and you can find his work archived at the Bureau of Land Management website. He most likely was there working on behalf of John Cleves Symmes. Symmes was a Revolutionary War Colonel and congressional delegate who had sent scouts to the Ohio territory in search of profitable land. He organized a group called the Miami Company. The U.S. Government handed over 200 thousand acres plus a 23 thousand acre township Martin was likely surveying. The Symmes Purchase included a village called Losantiville – later named Cincinnati. This area is also home to a curiously named university that many mistake for being in Florida – Miami University, also known as Miami of Ohio. It was one of the original eight Ivy League schools and is named, like the company, after the Miami Rivers in Ohio.* William Morris: New York. Morris was perhaps the one a
A Nation Squared
Hello Interactors,This week we pick up where we left off with Thomas Jefferson. Jefferson had appointed Thomas Hutchins to be Geographer of the United States in 1781. In 1784 Jefferson was preparing for expansion west and was combing over Hutchins’ descriptions of what lie west of his beloved Virginia. Jefferson was dubious of Hutchins’ mapping facts and took it up with him in a personal correspondence. What follows is the unfolding of a cartography project of Roman scale. And the birth of an empire.As interactors, you’re special individuals self-selected to be a part of an evolutionary journey. You’re also members of an attentive community so I welcome your participation.Please leave your comments below or feel free to email me directly.Now let’s go…ON TURTLE ISLANDThomas Jefferson was born with a passion for measuring the world. His father, Peter Jefferson, was a surveyor, naturalist, cartographer, and colonial settler. He instilled in his son a love and interest in the culture and languages the Indigenous people. Later in life, Thomas Jefferson even partnered with another Indigenous admirer and fellow colonizer I mentioned back in February, Roger Williams. They collaborated on documenting the nuances of local native languages. Jefferson compiled twenty years of notes on Indigenous dialects and culture that travelled with him to New York City when he became president. Upon returning to Monticello the boatmen responsible for transporting his belongings ripped opened a box containing the precious papers in search of valuables to be stolen. When all they saw were piles of paper, they tossed them overboard. Decades of research and knowledge lost. As a young man, Jefferson spent time with Indigenous people – and so did his father. In a letter to John Adams, Jefferson writes, “Concerning Indians . . . in the early part of my life, I was very familiar, and acquired impressions of attachment and commiseration for them which have never been obliterated. Before the Revolution, they were in the habit of coming often and in great numbers to the seat of government where I was very much with them. I knew much the great Ontassete, the warrior and orator of the Cherokees; he was always the guest of my father, on his journey's to and from Williamsburg.”Even as Jefferson was scheming to carve up the land his forefathers had invaded into a cartesian grid, he held natives in high regard, writing in 1785,“I am safe in affirming that the proofs of genius given by the Indians place them on a level with the whites. . . . I have seen some thousands myself, and conversed much with them. . . . I believe the Indian to be in body and mind equal to the white man.”Thomas envisioned an interracial “Continental America”. Later, in 1802, he said to a group of native Americans, "Your blood will mix with ours, and will spread, with ours, over this great island." The word ‘island’ is most likely in reference to ‘Turtle Island’ which is rooted in the Native North American creation story, including the Haudenosaunee – a confederacy of six nations in the Northeast. This ancient tale tells how the ‘Great Sprit’ (a term Jefferson commonly used in place of the word ‘God’) created the land of America and its people – complex people capable of both good and evil. As Jefferson was toiling over Hutchins’ maps and words in 1784, looking west at the silhouetted Blue Ridge Mountains of Virginia, he was about to embark on an endeavor that history can now regard as both good and evil.JEFFERSON MISCALCULATESJefferson loved contemplating the universe and fell in love with astronomy in college in 1760. The study of the stars gave him an appreciation for the universe Isaac Newton had revealed a century before. On his transatlantic trips to and from England and France, he’d be on deck exacting the stars dotting the dark sky and calculating meridians as the boat curved along the earth’s surface. He collected maps, globes, and sextants and obsessed over the global coordinate system. He wasn’t alone. This was a time when a consistent calculation of longitude remained elusive and there was a £20,000 prize for a solution. Newton believed the solution would come from astronomy, but woodworker and clockmaker, John Harrison, invented a mechanical marine chronometer and won the prize in 1773. So it should come as no surprise that Jefferson was able to scrutinize the maps his newly appointed chief geographer, Thomas Hutchins, had published of the territories west of Virginia. Hutchins had been in this role just three years when Jefferson wrote to him with this inquiry in 1784:SirI have been recurring to your pamphlet (which I borrowed for that purpose) for the times at which the inundations begin and end in the Missouri, Missisipi, Illinois, Ohio, Wabache, but I do not find it mentioned there. Will you be so kind as to give me as accurate an account of these times as you can? Does the Tanissee overflow periodically? I suppose not. Will you give me leave to correct an err
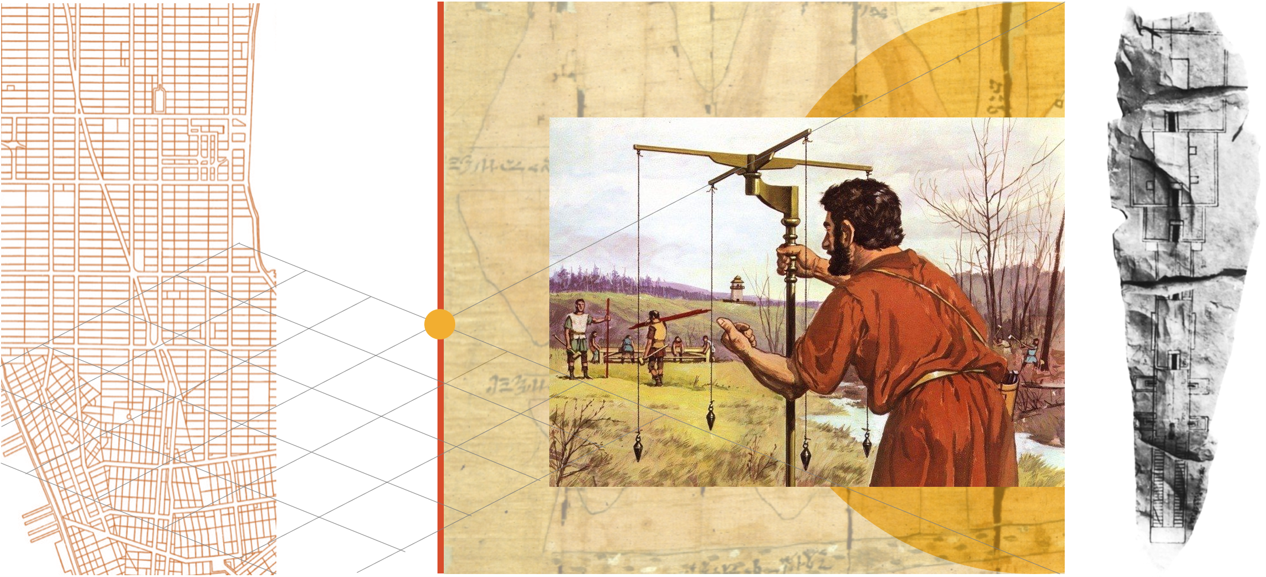
A Groma from Rome Finds a New Home
Hello Interactors,This is week two of Cartography. The next few posts will serve as a series looking at how the map of the United States came to be and its role in charting our history.This post looks behind the origins of those neatly organized polygons that enable the choropleth maps I talked about last week. Mapmaking’s history dates back to ancient times – as do the motivations behind them. While maps help us to better understand and interact with the world, they also help establish authority and control.As interactors, you’re special individuals self-selected to be a part of an evolutionary journey. You’re also members of an attentive community so I welcome your participation.Please leave your comments below or feel free to email me directly.Now let’s go…Maps are as elemental to communication as numbers and words. Perhaps even more so. Anthropologists acknowledge that unlike numbers and words, maps don’t require any formal training to understand. It’s been a form of communication for almost as long as we’ve been around. The oldest known map, a map of stars in the sky found in the Lascaux caves in France, dates back to half way through the stone age. It’s hard to imagine just how long ago that was. But imagine your arm as a timeline. If homo sapiens originated at the shoulder and we’re now at the tip of the middle finger, cavernous cartography was happening just above the elbow. Who knows why, but somebody had something to say and they said it with a map. Using their arm to do it. The Cambridge dictionary says a map is: “a drawing of the earth's surface, or part of that surface, showing the shape and position of different countries, political borders, natural features such as rivers and mountains, and artificial features such as roads and buildings.” As early as the Egyptians, people have been drawing maps of the natural landscape both by hand and with the aid of technology. The Ancient Egyptian Turin Gold Mine Map is the oldest surviving land map. It dates back to 1150 BC and features prominent horizontal dried river beds surrounded by mountains with patches of vegetation scattered about. These rocky roads are typical of the riverbeds of this desert that extend to the Red Sea. The map’s legend, written in the ancient Egyptian equivalent of cursive reads, "the mountains where gold is worked: they are colored in red." By this time, the Egyptians were also skilled at surveying. We need only look at the precision of pyramids to see they had a firm grasp of geometry. In fact, the Egyptians were employing elements of the Pythagorean theorem 1500 years before it’s namesake, Pythagoras. The word Geometry is derived from Greek and literally means the measure of the earth. (geo-metron, or earth-measure). There are few surviving maps illustrating the precision required for the surveys their construction. But etched in this 14 centimeter high narrow sliver of stone are the plans for a tomb found in the Valley of the Kings. It’s believed to be the tomb of Ramesses IX who died in 1111 BC.The Greek historian, Herodotus, was the first known historian to write history based on found antiquities and here’s what he observed about the Egyptian’s use of surveying and geometry for a purpose other than tombs and pyramids. Taxation.“…the king, the priests went on to say, who was responsible for the division and distribution of land into individual square holdings, of equal size, among the Egyptians and for making the plots his source of revenue by fixing the amount of tax to be paid yearly on each holding…I attribute the invention of geometry to this cause and from Egypt it spread to Greece.” The Greek and Romans went on to perfect the practice of surveying and mapping. In 150 AD Claudius Ptolemy published his massive book called Geography. It was a collection of maps but also a scientific and cartographic treatise. It included a map of the world with a curved grid of latitude and longitude that went on to influence and inspired cartographers well into the Renaissance. AUGUSTUS CHARTISPtolemy’s work and reputation is so monumental that it’s overshadowed the proliferation, progress, and sometimes punishing practice of practical cartography by the Romans. The surveying and plotting of infrastructure and land was the fuel that fed the fire of Roman expansion and colonization. When we think of the gridded streets and blocks of our modern cities, it’s easy to imagine a map of, say, New York. But large-scale rectilinear allocation of land started in ancient Rome. In the decades leading up to the first century A.D., Augustus requested surveys of fixed dimensions to designate blocks, or ‘centuries’ as they were called. Major and minor roads ran between them and each block and street was labeled. Like the maps so common today.Cartography historian, O. A. W. Dilke writes, “One of the main advantages of a detailed map of Rome was to improve the efficiency of the city's administration. Augustus had divided Rome into fourteen districts, e
I'd Rather Be Spinning Logos
Hello Interactors,Welcome to spring. We now transition to cartography. This post weaves the story of how I came to study cartography as an undergrad, the challenges of drawing maps, and how a spinning logo led to a mapping feature in Excel.As interactors, you’re special individuals self-selected to be a part of an evolutionary journey. You’re also members of an attentive community so I welcome your participation.Please leave your comments below or feel free to email me directly.Now let’s go…I didn’t set out to be a geography major. I didn’t even know the word ‘cartography’. My primary interest in high school was computer graphics. My two favorite subjects in school were math and art and I saw computer graphics as a way to combine them. I was also addicted to MTV. Yes, I was there for the music, but I was also in love with their animated logos. That’s when I knew what I wanted to do when I grew up. Animate graphics with a computer. Finding a university to teach me this proved elusive. I ended up following a high school friend to Colorado State where he was already studying graphic design. But toward the end of my fist year, the head of the design department settled with me, “Look Brad, I don’t think you’re going to find what you’re looking for here. You might try California.” So I loaded up the truck and I moved to Beverly. Hill’s, that is. Swimming pools, movie stars.My cousin lived in L.A., so I moved in with her and her husband. I took a year off, worked, and searched for the right school. By this time, 1985, Dire Strait’s video, ‘Money for Nothing’, had come out. It’s was one of the first ever computer animated videos. It also featured Sting’s familiar cry, “I want my MTV…” I hear you, Sting. I still want my MTV. Having seen this video, I was even more certain of what I wanted to do. In a twist of fate, my cousin helped me land a job as a corporate gopher for a consumer electronics distributor. I was living that line from the ‘Money for Nothing’ video: “We gotta move these color TVs…”In 1987, the popular computer graphic conference, SIGGRAPH, was in Anaheim so I attended. I was in heaven. These were my people. I found my way to a booth with a cool logo and name: Wavefront Technologies.The people were cool too. Best yet, they were located in Santa Barbara. I decided I wanted to work for this company, so I headed north and enrolled at University of California, Santa Barbara. Then came the hard part. What do I major in?Computer graphics was only offered in graduate level computer science courses. That seemed too long and arduous for my taste. I remember sitting there frustrated one day, thumbing through the course catalog my roommate had left open to his major, environmental studies. I saw a class offered by the geography department in mapmaking – cartography. As I looked further I found computer cartography. I soon realized I could learn computer graphics and graphic design through cartography. I then declared geography as my major and was finally on a path to my ultimate goal — Wavefront.DRAWING ON THE BRAIN TO DRAW MAPSDrawing maps is difficult. It seems easy. From last week’s post on cognitive maps we learned making maps comes natural to the brain. We all have what we need to draw a map right there in our head, but getting it to come out of our hand and on to paper is challenging. And error prone.Around the time I started at UCSB, geography professor and mental map legend, Reg Golledge, conducted a study on the ability and accuracy of sketching a map from memory. Inspired by research dating back to the 50’s, the study focused on children. Young people have the cognitive skills to recognize anchor-points in the environment, but lack the skill, expertise, and experience in drawing maps. Golledge had an 11 year old boy walk a designated path forward and reverse in his suburban neighborhood just off campus in Goleta, California. He repeated this path over the course of five days and was asked to write down his navigation strategy; including the list of landmarks and features used in his strategy. He then wrote down a list of steps required to complete the journey that another kid his age could understand. And, lastly, he had him draw a map. Similar to the Carr study mentioned last week, the boy was also shown a video of the journey and was asked to anticipate which landmarks would be next in the sequence of his path. What Golledge found is that by day five, the boy was able to draw a fairly detailed map of the path. Like the Carr study, the more times the boy walked the path, the more detail the brain was filling in.As you can see, the origin and destination of the journey were easier to sketch. Over time, other segments progressively filled in over time. But what’s interesting is the gaps found in the boy’s early maps weren’t there in his verbal description of what was to come next in the video. Even in early trials the boy could accurately describe what was coming next in the sequence watching the video,
Take Your Head for a Walk
Hello Interactors,We’re coming up on spring in the northern hemisphere so this post eases us in to cartography — via the brain.Cognitive maps play an integral role in our ability to interact with place. We don’t even give it much thought, but our brains are amazing cartographers. As interactors, you’re special individuals self-selected to be a part of an evolutionary journey. You’re also members of an attentive community so I welcome your participation.Please leave your comments below or feel free to email me directly.Now let’s go…LOCK DOWN. WALK ON.It was a year ago this month that I started walking. A lot. For me anyway. Last summer I’d walk four or so miles every other day and up to 17 miles on the weekend. I would pull out my phone, launch Google Maps, and look for a patch of green within the city limits of my town, Kirkland, Washington. I would then set out to visit it by foot.I’ve lived in Kirkland for nearly three decades. Only in this last year do I feel like I really know it. For thirty years I’d wake up, eat breakfast, jump in my car, and commute 6.5 miles to Microsoft. Yes, I’d sometimes bike or bus and I’ve run and biked around Kirkland many times. But, honestly, I haven’t really lived in Kirkland, I’ve mostly just slept here. If anything, I’ve mostly lived on its roads. It’s a common pattern in America. Climb in a car and hit the road on your daily commute. The lockdown has disrupted that routine for those of us fortunate enough to work from home. Many, including me, don’t miss the commute. But others, I’ve heard, miss having the alone time that comes with the Single-Occupancy Vehicle. Zooming has taken on new meaning these days, but there’s something satisfying about zooming along alone in your thoughts in a climate controlled capsule caressing the concrete. I think we’ve probably all experienced those moments when you realize you have no recollection of the last mile or so of driving. We are literally lost in our thoughts.But you’re taking it all in whether you know it or not. Your brain does not like being lost, so it makes sure your eyes are capturing images of your surroundings. It uses those images to build a map in your brain – a cognitive map. The commuter’s cognitive map is special map based on the path of your commute. Each successive trip further imprints those images into your brain while filling gaps in between. It’s building a coherent collection of ordered memories. Unknowingly, the brain stores a collection of anchor-points that are reliably recalled should the need arise to alter your interaction with place. TURN LEFT AT THE WATERTOWERIn 1969, MIT Urban Design professor and practitioner, Stephen Carr and Northeastern University Psychology professor, Dale Schissler, conducted an experiment to better understand how we build up impressions of a place. They started by interviewing commuters in the Boston area, including passengers. They had them relive their journeys and recorded environmental cues they recalled. For example, a sign, a building, or a tree. The next day they strapped a camera to their head with an optical device pointing at the cornea of their eye. They wanted to see exactly what the commuters saw and where exactly they were looking. I’m not sure what it was like strapping a 1960’s era camera to the head, but it probably looked like this Evans and Sutherland virtual reality contraption from 1960:While on their journey, commuters where prompted to verbally describe landmarks that were recorded by the researchers. Days later, they showed the commuters the images they observed along with film footage from the trip and had them again identify landmarks on their journey. The researchers tallied which images were recalled by each set of commuters and determined these as meaningful landmarks. What they found is the number of meaningful landmarks varied among those new to the area, routine commuters, and passengers.The average driver, including those new to the area, recalled 10 objects over a four mile section of the trip. Passengers recalled 21. And routine commuters were able to recall 28. But there was one thing they all had in common. They remembered similar images and in the same order. Routine commuters were adding more detail and filling in gaps, but appeared to be using the same anchor-points as a drivers new to the area.This is a significant finding. It suggests our brain is reliable at building a cognitive map made of anchor-points – even if the path is unfamiliar to us. We use these anchor-points as orientation should we need to recall them at a later time. It also demonstrates our ability to learn and modify our path and our image of a city over time.IT’S IN THE BRAINNearly a decade later, in 1978, neuroscientist John O’Keefe had a similar curiosity of cognitive maps. Instead of tracking and measuring the mechanics of the eye, he probed and measured the cellular activity of the brain. By implanting microelectrodes into the hippocampus region of a lab rat’s brai

Bill and Brad's Excellent Adventure
Hello Interactors,More Microsoft history and it’s role in the growth of itself, other companies around the world, and our pervasive connections to each other and the internet. I was lucky to play a small part in this transformation. I did my best to understand the behavior of people using the software that fueled these expansions. It taught me lessons I’m now applying to understanding behavior of people interacting with place.As interactors, you’re special individuals self-selected to be a part of an evolutionary journey. You’re also members of an attentive community. I welcome your participation.Interplace is a place for people to interact so please leave your comments below or feel free to email me directly. Now let’s go…MICROSERFSIn my early days at Microsoft, the place felt more like a startup. I had come from a company of 120 people, so 11,000 people should have felt huge. But compared to the 168,000 of today, it was small. The culture was different too. People were there to make something – not to be somebody. This attitude is best ensconced in Douglas Coupland’s 1995 novel, Microserfs. Set on Microsoft’s forested campus, it gives a peek into ‘geek culture’ of the early 90s. It also exposes the heartfelt belief that we really were doing something meaningful.“What is the search for the next great compelling application but a search for the human identity?” “Maybe thinking you're supposed to 'have a life' is a stupid way of buying into an untenable 1950s narrative of what life *supposed* to be. How do we know that all of these people with 'no lives' aren't really on the new frontier of human sentience and preceptions?” – Douglas Coupland, MicroserfsWhen this book came out, Windows 95 was just starting up. PC sales were revving. Selling at the rate of 40 Million per year it’s success pushed Intel’s revenue growth to 41% in a single year. And the promise of the World Wide Web was taking hold. Bill’s book, The Road Ahead, had come out and he had a vision. That vision was expressed in a keynote at COMDEX, a popular technology conference. The concept was called, ‘Information at your Fingertips’ and he needed a murder mystery movie to tell the story. My team designed the PC desktop interactions in this video. We imagined what interactions would be like in 2005. At one point in the video, Bill jokingly refers to our work as a ‘rather cluttered desktop’. Soon after you’ll see Bill introducing long file names and video conferencing. But in 1995, that meant video conferencing with somebody in a public phone booth! People around the world were buying in to Bill’s vision — including major corporations and governments. Businesses multiplied PC growth. And so did connectivity. Bill’s vision of a PC on every desk was coming true. Connecting computers to the internet really did put information at your fingertips. Buying a PC in 1995 was the entry price to a new world of communication. Windows 95 made connecting to the internet easy, Office 95 simplified sending email, and the Internet Explorer let you, well, explore the internet. Information was not just gingerly touching the tips of fingers. Hands were cupped and people were scooping up tiny bits of addictive bytes and gorging themselves. We still are. In 1996 36 million people were on the internet. By 2000 it grew tenfold to 360 million. A decade later it jumped to two billion. Estimates now put that number at around four billion – over half of the world’s population. A reminder of the advantage and privilege half the world holds over the other half. GROW BABY GROWSatisfying this growing appetite for information required more than software. Cables needed to be run, server farms needed built, and somebody had to manage all this information and technology. Enter the IT Manager. IT had been around for some time already, but installing, managing, and controlling access to Windows, Office, and all these PCs and peripherals put real strains on IT departments. So did the need to control access to the exponential growth of documents, spreadsheets, and presentations. Other comparable modes of communication, like snail mail and telephones, only grew at a rate of around 10% over a much longer period of time. The expansion of IT departments mirrored this curve. Digital connection and communication between people inside companies fuels the same ingenuity that physical connections do in dense cities. The bigger the city, the more innovation occurs. Successful cities attract talented and conscientious people generating superlinear population growth and creativity. It’s why bigger cities and bigger companies have bigger stockpiles of patents. “Just as bounded growth in biology follows from the sublinear scaling of metabolic rate, the superlinear scaling of wealth creation and innovation (as measured by patent production, for example) leads to unbounded, often faster-than-exponential growth consistent with open-ended economies.”– Geoffrey West. Scale: The Universal Laws of Life, Grow
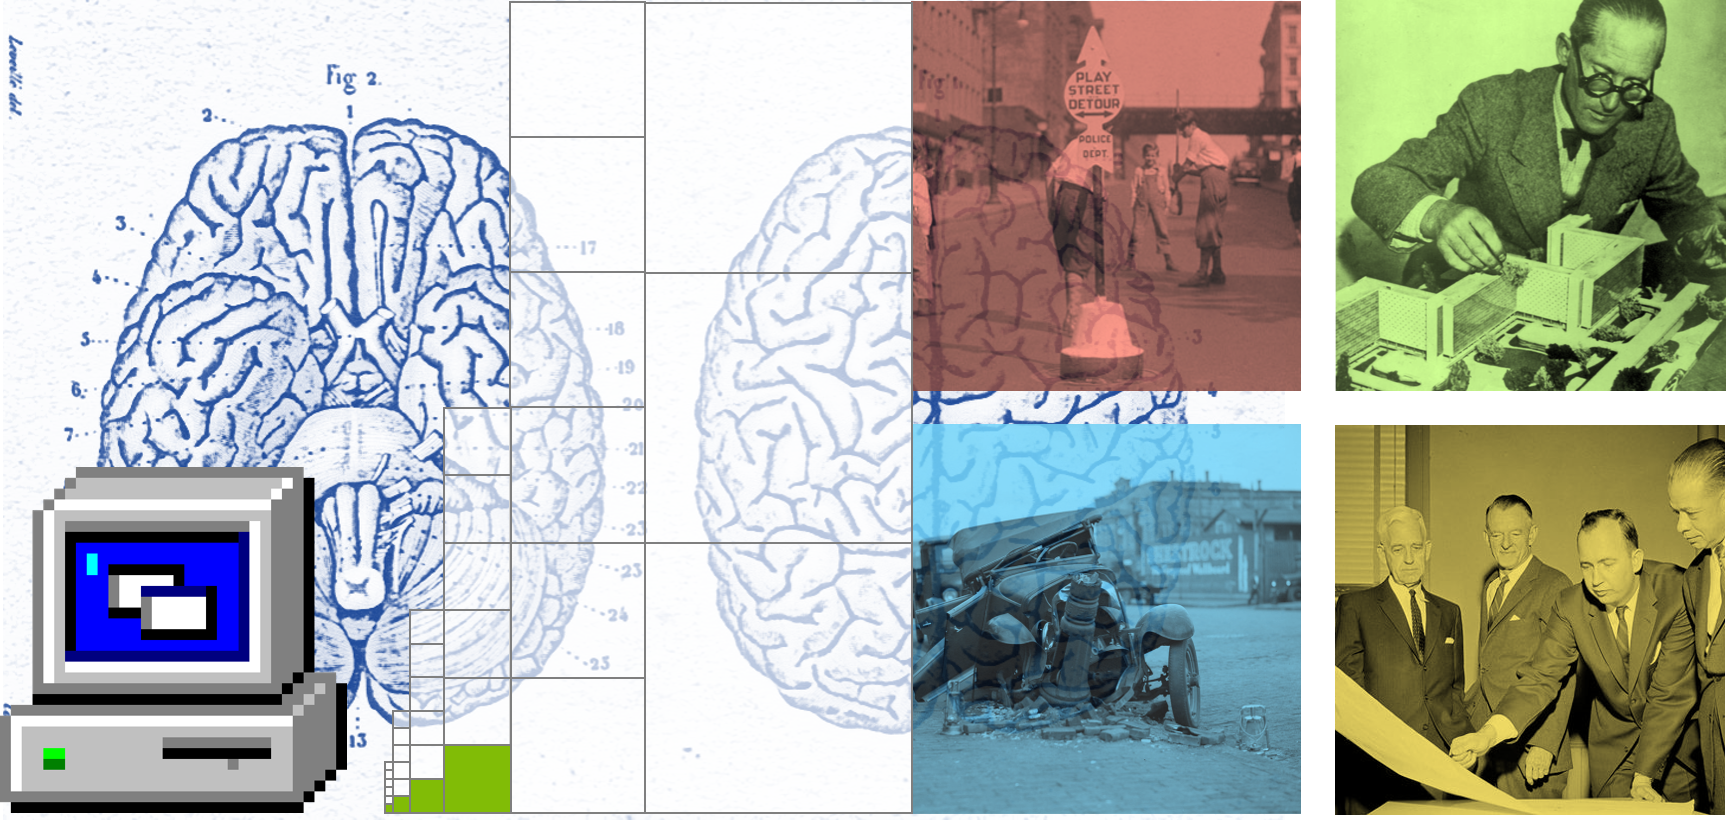
A Computer on Every Desk and a Car in Every Garage
Welcome to March, Interactors!Despite the daffodils blooming here in Kirkland, it’s still winter. And I’m still focused on Behavior. This post bridges interface with interplace through the one thing they have in common: Cognition. Weaving past and present, I look at how our rational selves can do irrational things. Or at least it seems that way.As interactors, you’re special individuals self-selected to be a part of an evolutionary journey. You’re also members of an attentive community. I welcome your participation.Interplace is a place for people to interact so please leave your comments below or feel free to email me directly. Thanks to you who have! It’s nice reconnecting. 🙏🏼Now let’s go…I started at Microsoft designing icons. Using four shades of gray, in a fixed array, a map of bits was arranged. A bitmap. Toolbar buttons were all the rage in 1990’s and those buttons needed icons. And lots of them.Soon I went from poking pixels in a grid to nudging widgets on the screen. More than bitmaps, I was mapping interfaces across a suite of products known now as Office. Windows was taking off too. The platform was becoming ubiquitous and attracting developers, developers, and more developers. Microsoft unleashed an entire software industry that empowered every person and organization to achieve more. Bill Gates wished for “A computer on every desk and in every home” and his wish was coming true.MOTORISTS, MOTORISTS, MOTORISTSBill’s famous quote reminds me of a 1928 Herbert Hoover campaign slogan, “a chicken in every pot and a car in the garage.” Here it is appearing in a Republican Party ad in the Pittsburgh Sun-Telegraph:“Republican prosperity has reduced hours and increased earning capacity, silenced discontent, put the proverbial “chicken in every pot.” And a car in every backyard, to boot.”This was the year the Ford Model A replaced the Model T. Released in December of 1927, Ford sold one million Model A’s by the end of January. They doubled that number by July. America’s lust for cars was already in full swing and the industry was growing. And so was the number of people these cars were killing. From the time the first Model T rolled off the line to the day it was retired, the number of vehicle fatalities was growing exponentially.The automobile fundamentally changed how people interact with place. The effect was especially felt by Henry Ford’s target market: Farmers. The Model T made their world smaller. They could now travel distances in half the time their feet or horse could take them before. This not only improved their farming business, it changed their lives. But it took just as many.The negative societal effects of the automobile continued through the century and are with us today. The same space-time continuum shift that farmers experienced is what led to suburban sprawl. And the buildout of the national highway systems only accelerated the effect.By the 1950’s, decades of research had been conducted on the negative effects of the automobile. But the focus was mostly on the urban form – cities and roads. Researchers were trapped in quantitative economic measures of the flow of goods and people across space and time. Traffic safety research focused on the design of roads and paternalist policing of policies targeted victims. Despite centuries of streets as a place to live and play, they became unlawful and sinful traps. Roads were suddenly for cars, not people. So efforts were made to shame and blame the victims into submission.WHAT AN IDIOTMicrosoft has seen its fair share of victim blaming too. As the software industry was growing, so was the science of computer-human interaction. By the time I got to Microsoft in 1992, usability labs had already been built. They were ordinary adjoining offices just down the hall from mine that featured a one-way mirror as a wall. Some of the first studies conducted were on the effectiveness of those dozens of icons I was designing.We focused on two quantitative measures: recognition and recall. These measure a person’s ability to recognize an image and then recall it from memory. There were other quantitative measures for more complex interfaces like ‘time on task’ – the measure of how long it takes someone to achieve a given task.Just as those researchers in the early decades of automobiles were focused on quantitative measures of the physical interfaces of cities, we were focused on quantitative measures of computer interfaces in the early decades of the personal computer. And sometimes, when a designer or engineer would observe a lab participant doing something ‘wrong’. Just as it was deemed ‘wrong’ for the victims of car violence to play in streets, I watched people blame the victim of poor user interface design in our own usability labs.Once while studying a feature in Excel, I watched through the one-way mirror as study participant struggled to achieve an assigned task on time. One of the Excel team members was getting agitated watching this poor guy str
WASPs and Weeds Gone Wild
Hey Interactors!A mid-week surprise. I’m experimenting with recording select episodes for those who would rather listen than read. I recorded my final February post, WASPs and Weeds Gone Wild — Complete with amateur voice acting. 🙄It’s my first attempt at this kind of content, but I look forward to seeing where it goes. Let me know what you think!And If you haven’t already, please check out the other three February posts.* Raccoons Destroyed My Lawn: “Some White folks have a way of arrogantly explaining away societal problems with clever theories, models, and proclamations. Guilty as charged…It’s time we look through our ‘socioscope’ and use math and complexity science to tell us what we’re seeing in our society. The more we understand how this virus within our socioeconomic and political system works, the sooner we’ll find a cure.” * What the World Needs Now is Love:“We live in a world of plurality, but we know there’s common ground. Is it too much to ask that we all strive to be kind, compassionate, fair, and just? There is no place for meanness and nobody likes a bully. A human theory of love is needed, though we won’t understand it fully. We are malleable creatures who can adapt to change, so let change begin.”* The Lone Star Is in a Frozen State: “In many ways, this story of Texas is a proxy for the story of the United States. A band of white dudes ‘discover’ land occupied by brown people and take it over. Neil deGrasse Tyson says you can explain U.S. history in six words, “Is this yours? It’s mine now!” Why? Because White settler colonialists want to bring their Black slaves, plant some crops, and start making some money. European colonial conquests of Indigenous occupied lands by white men has always been about empire building. The United States is no exception. “Thanks for all the support, Interactors! Spread the word! 🙏🏼Brad This is a public episode. If you would like to discuss this with other subscribers or get access to bonus episodes, visit interplace.io