
Data Stories
170 episodes — Page 1 of 4

Ep 170170 | Formalizing Design with Gabrielle Mérite and Alan Wilson
170 | Formalizing Design with Gabrielle Mérite and Alan Wilson

Ep 169169 | Data Conversations with Vidya Setlur
169 | Data Conversations with Vidya Setlur

Ep 168168 | Highlights from IEEE VIS'22 with Tamara Munzner
168 | Highlights from IEEE VIS'22 with Tamara Munzner

Ep 167167 | Visualization and Statistics with Andrew Gelman and Jessica Hullman
167 | Visualization and Statistics with Andrew Gelman and Jessica Hullman

Ep 166166 | Catching up with Amanda Makulec
166 | Catching up with Amanda Makulec

Ep 165165 | Data Visualization Accessibility with Sarah Fossheim
165 | Data Visualization Accessibility with Sarah Fossheim
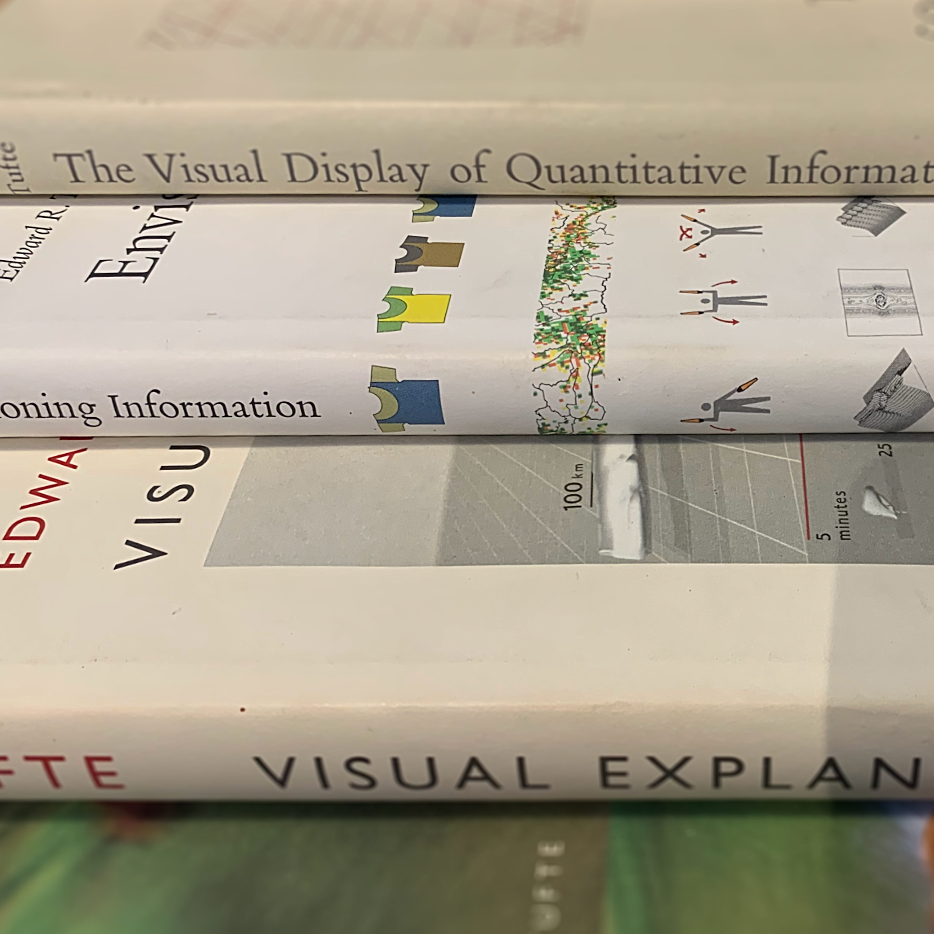
Ep 164164 | Edward Tufte's complete work with Sandra Rendgen
164 | Edward Tufte's complete work with Sandra Rendgen

Ep 163163 | svelte.js for web-based dataviz with Amelia Wattenberger
163 | svelte.js for web-based dataviz with Amelia Wattenberger

Ep 162162 | Highlights from IEEE VIS'20 with Miriah Meyer and Danielle Szafir
162 | Highlights from IEEE VIS'20 with Miriah Meyer and Danielle Szafir

Ep 161161 | People of the Pandemic with Shirley Wu
161 | People of the Pandemic with Shirley Wu
Ep 160160 | Visualizing COVID-19 with Carl Bergstrom
160 | Visualizing COVID-19 with Carl Bergstrom

Ep 159159 | Viz Agencies: Dataveyes and Accurat
159 | Viz Agencies: Dataveyes and Accurat

Ep 158158 | Viz Agencies: CLEVER°FRANKE and Interactive Things
158 | Viz Agencies: CLEVER°FRANKE and Interactive Things

Ep 157157 | Spatial Thinking with Barbara Tversky
157 | Spatial Thinking with Barbara Tversky
Ep 156156 | Visualizing Fairness in Machine Learning with Yongsu Ahn and Alex Cabrera
156 | Visualizing Fairness in Machine Learning with Yongsu Ahn and Alex Cabrera

Ep 155155 | Flourish with Duncan Clark
Duncan is the CEO of Flourish, a popular data visualization tool to help people create storytelling visualizations from data. Duncan founded Flourish together with Robin Houston in 2016 and since then they made a lot of progress and acquired a large user base.

Ep 154154 | Visualizing Global Warming with IPCC with Angela Morelli and Tom Gabriel Johansen
154 | Visualizing Global Warming with IPCC with Angela Morelli and Tom Gabriel Johansen

Ep 153153 | Data Art and Visual Programming with Marcin Ignac from Variable
153 | Data Art and Visual Programming with Marcin Ignac from Variable
Ep 152152 | Year in Review 2019
152 | Year in Review 2019

Ep 151151 | Future Data Interfaces with David Sheldon-Hicks
151 | Future Data Interfaces with David Sheldon-Hicks

Ep 150150 | Highlights from IEEE VIS'19 with Tamara Munzner and Robert Kosara
150 | Highlights from IEEE VIS'19 with Tamara Munzner and Robert Kosara

Ep 149149 | xkcd or the art of data storytelling with web cartoons
Randall Munroe is the mastermind behind the xkcd webcomics which have zillions of fans around the globe. In his stick figure cartoons and hilarious mini-stories, he comments on complicated scientific issues. Over the years, Randall has also created a number of data-heavy visualizations. Some of them tackle pressing issues such as climate change, while others mock conventions of visualization such as map projections or chart types.

Ep 148148 | Cognitive Science for Data Visualization with Lace Padilla
148 | Cognitive Science for Data Visualization with Lace Padilla

Ep 147147 | Iconic Climate Visuals with Ed Hawkins
We have climate scientist Ed Hawkins on the show to talk about climate visualization. Ed is the person behind the famous Climate Spirals and Climate Stripe visualizations, both of which have a made a huge impact beyond the climate science community.

Ep 146146 | Sweating the details with Nicholas Rougeux
We have digital artist Nicholas Rougeux on the show to talk about his beautiful data art projects and the processes he follows. Nicholas created numerous iconic pieces with an extraordinary attention to details, such as "Seeing Music"...

Ep 145145 | FT Data Crunch with Federica Cocco and John Burn-Murdoch
We have Federica Cocco and John Burn-Murdoch on the show to talk about their new Financial Times visualization series called Data Crunch. The series features Federica and John having a data-driven conversation about some social or economic trend while aided by graphs and charts. It's a new way of doing data visualization...

Ep 144144 | History of Information Graphics with Sandra Rendgen
144 | History of Information Graphics with Sandra Rendgen
Ep 143143 | The Pudding with Matt Daniels
We have Matt Daniels on the show again. He is the CEO of The Pudding, a collective of journalist-engineers that create visual essays that explain ideas debated in culture. Their pieces are incredibly engaging, somewhat witty and always stunning from the visual point of view.

Ep 142Data Is Personal with Evan Peck
[Our podcast is fully listener-supported. That’s why you don’t have to listen to ads! Please consider becoming a supporter on Patreon or sending us a one-time donation through Paypal. And thank you!] We have Evan Peck on the show to talk about the research he and his students recently published on "Data Is Personal". The study consists of 42 interviews made in rural Pennsylvania to see how people from different educational backgrounds ranked a set of various data visualizations.

Ep 141Sketching and Visual Thinking with Eva-Lotta Lamm
[Our podcast is fully listener-supported. That’s why you don’t have to listen to ads! Please consider becoming a supporter on Patreon or sending us a one-time donation through Paypal. And thank you!] We have Eva-Lotta Lamm joining us to talk about the value of sketching and how it relates to data visualization. Eva-Lotta is a UX designer turned expert on sketching and sketchnoting: the art of summarizing talks through sketches. In the show we talk about visual thinking, sketchnoting and parallels with data visualization.

Ep 140Data Visualization Society
We have the founding members of the Data Visualization society on the show to talk about how the project started and what are their plans for the future.

Ep 139Immersive Analytics with Tim Dwyer
We have Tim Dwyer for Monash University to talk about his work on Immersive Analytics.

Ep 138Turning Data into Sound with Hannah Davis
We are joined by Hannah Davis, a data visualization and sonification expert, to talk about how data sonification works and how she has gone about making her own amazing sonification projects, which create musical pieces based on data.

Ep 137137 | Visualizing Earth with Cameron Beccario
We are joined by Cameron Beccario who created the immensely impressive Earth visualization.

Ep 136Simulated Dendrochronology of U.S. Immigration with Pedro Cruz and John Wihbey
We have Pedro Cruz and John Wihbey on the show to talk about their beautiful project, the Simulated Dendrochronology of U.S. Immigration.

Ep 135135 | The "Dashboard Conspiracy" with Lyn Bartram and Alper Sarikaya
We have Lyn Bartram of Simon Fraser University and Alper Sarikaya of Microsoft Power BI on the show to talk about an exciting research project they developed to better understand dashboards.

Ep 134134 | Visualizing Uncertainty with Jessica Hullman and Matthew Kay
Jessica Hullman and Matthew Kay join us to discuss the how and why of visualizing information uncertainty.

Ep 133133 | Year Review 2018
Here we go! Another year has passed and lots has happened in the data visualization world.

Ep 132132 | A New Generation of DataViz Tools
We have Andy Kirk on the show to talk about a new generation of data visualization tools.
Ep 131131 | Peak Spotting
131 | Peak Spotting

Ep 130130 | Highlights from IEEE VIS 2018
130 | Highlights from IEEE VIS 2018

Ep 129129 | Views of the World with Robert Simmon
We have Robert Simmon from Planet Labs on the show to talk about satellite imagery and data visualization.

Ep 128128 | Visual Perception and Visualization with Steve Haroz
We have Steve Haroz on the show to talk about visual perception in visualization.

Ep 127127 | Storytelling with Data with Cole Nussbaumer Knaflic
We have Cole Nussbaumer Knaflic on the show to talk about her work in visual storytelling.

Ep 126126 | FlowingData with Nathan Yau
Nathan Yau joins us on the show to talk about his blog Flowing Data.

Ep 125125 | Researching the Boundaries of InfoVis with Sheelagh Carpendale
Sheelagh Carpendale is Professor in the Department of Computer Science at the University of Calgary, where she leads the Innovations in Visualization (InnoVis) research group.

Ep 124124 | Xenographics with Maarten Lambrechts
Maarten Lambrechts joins us to talk about his Xenographics project: a growing collection of "unusual charts and maps."

Ep 123123 | Touch Graphics with Steve Landau
We have on the show Steve Landau, the founder of Touch Graphics, a company dedicated to making information visualization accessible to blind and visually impaired people.

Ep 122122 | Visualizing Climate Change Scenarios with Boris Müller
We have Prof. Boris Müller from FH Potsdam on the show to discuss the SENSES research project, which visualizes climate change scenarios.

Ep 121121 | Declarative Visualization with Vega-Lite and Altair with Dominik Moritz, Jacob Vanderplas, Kanit “Ham” Wongsuphasawat
We have Dominik Moritz, Jacob Vanderplas, and Kanit “Ham” Wongsuphasawat on the show to talk about Vega-Lite and Altair.