Audio is streamed directly from the publisher (anchor.fm) as published in their RSS feed. Play Podcasts does not host this file. Rights-holders can request removal through the copyright & takedown page.
Show Notes
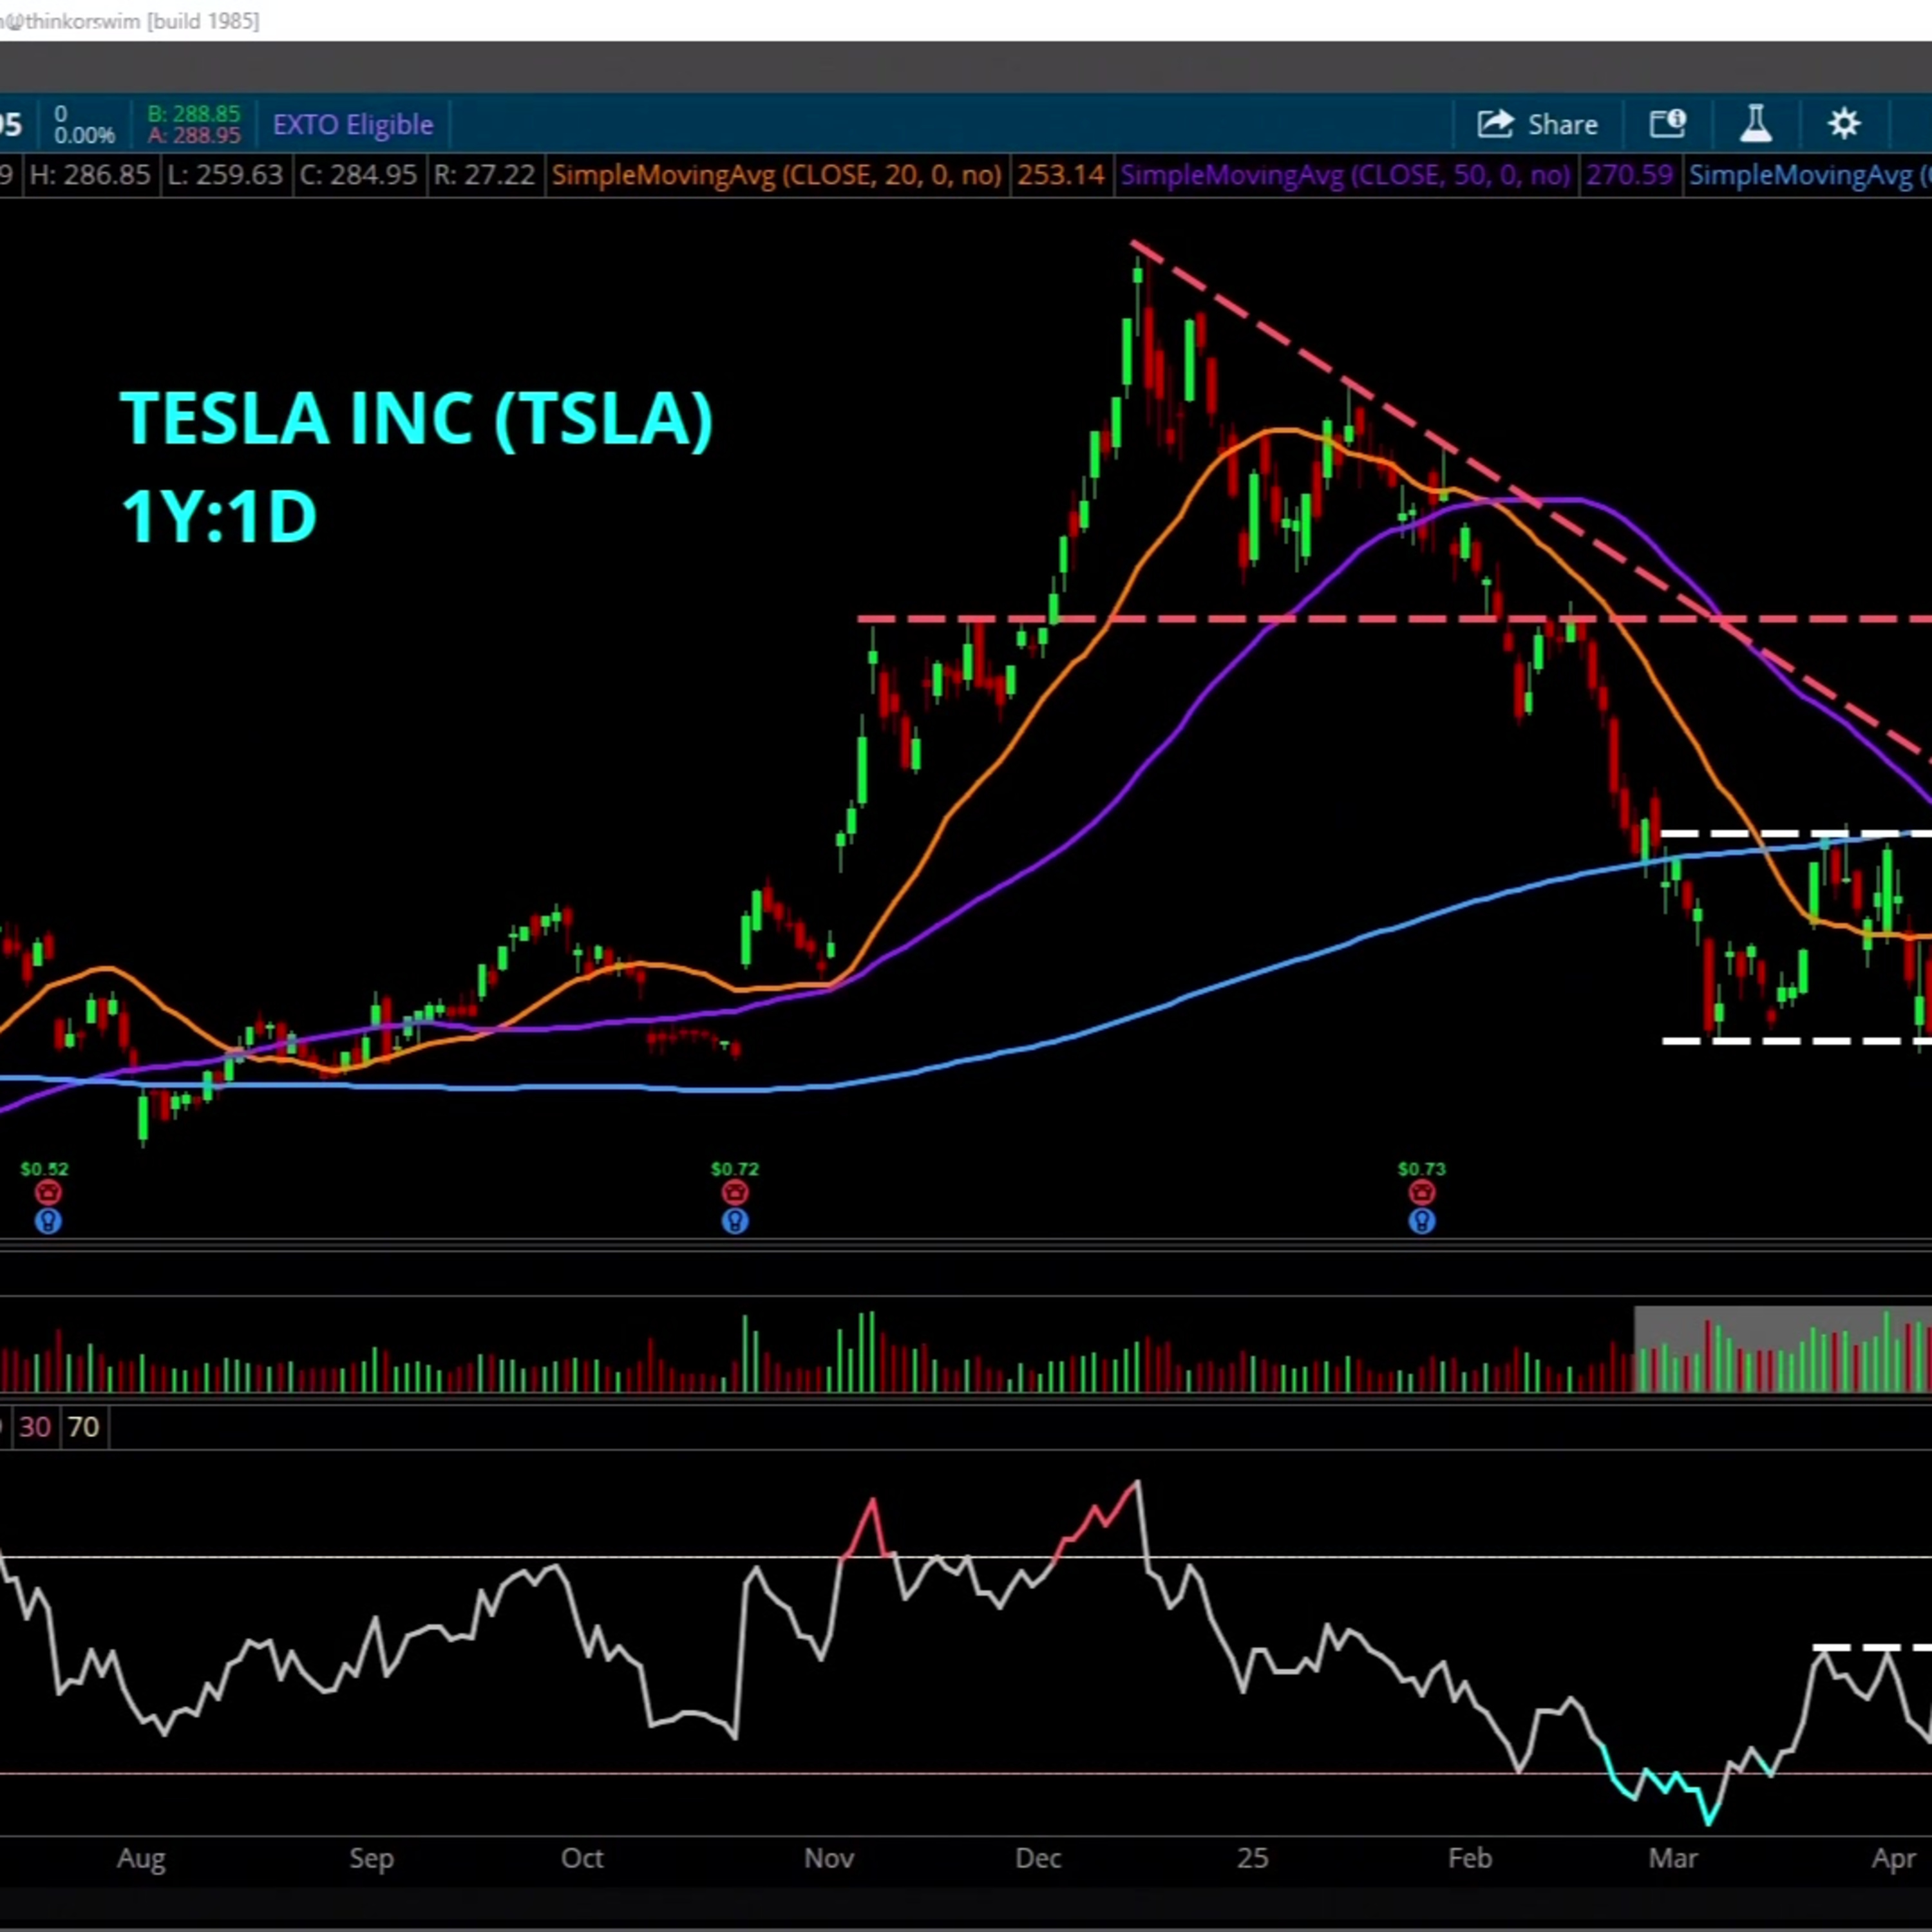
Breakout or Fakeout? Kevin Horner gets technical on the chart for Tesla (TSLA), which has seen a 28% move in just a week. With the stock now testing the $290 level - a key resistance area that coincides with the 200-day moving average - Horner says a close above this level could be a bullish sign. However, he also cautions that traders should be aware of the potential for a fakeout, especially with tariff-related news on the horizon.
======== Schwab Network ========
Empowering every investor and trader, every market day.
Subscribe to the Market Minute newsletter - https://schwabnetwork.com/subscribe
Download the iOS app - https://apps.apple.com/us/app/schwab-network/id1460719185
Download the Amazon Fire Tv App - https://www.amazon.com/TD-Ameritrade-Network/dp/B07KRD76C7
Watch on Sling - https://watch.sling.com/1/asset/191928615bd8d47686f94682aefaa007/watch
Watch on Vizio - https://www.vizio.com/en/watchfreeplus-explore
Watch on DistroTV - https://www.distro.tv/live/schwab-network/
Follow us on X – / schwabnetwork
Follow us on Facebook – / schwabnetwork
Follow us on LinkedIn - / schwab-network
About Schwab Network - https://schwabnetwork.com/about