Audio is streamed directly from the publisher (anchor.fm) as published in their RSS feed. Play Podcasts does not host this file. Rights-holders can request removal through the copyright & takedown page.
Show Notes
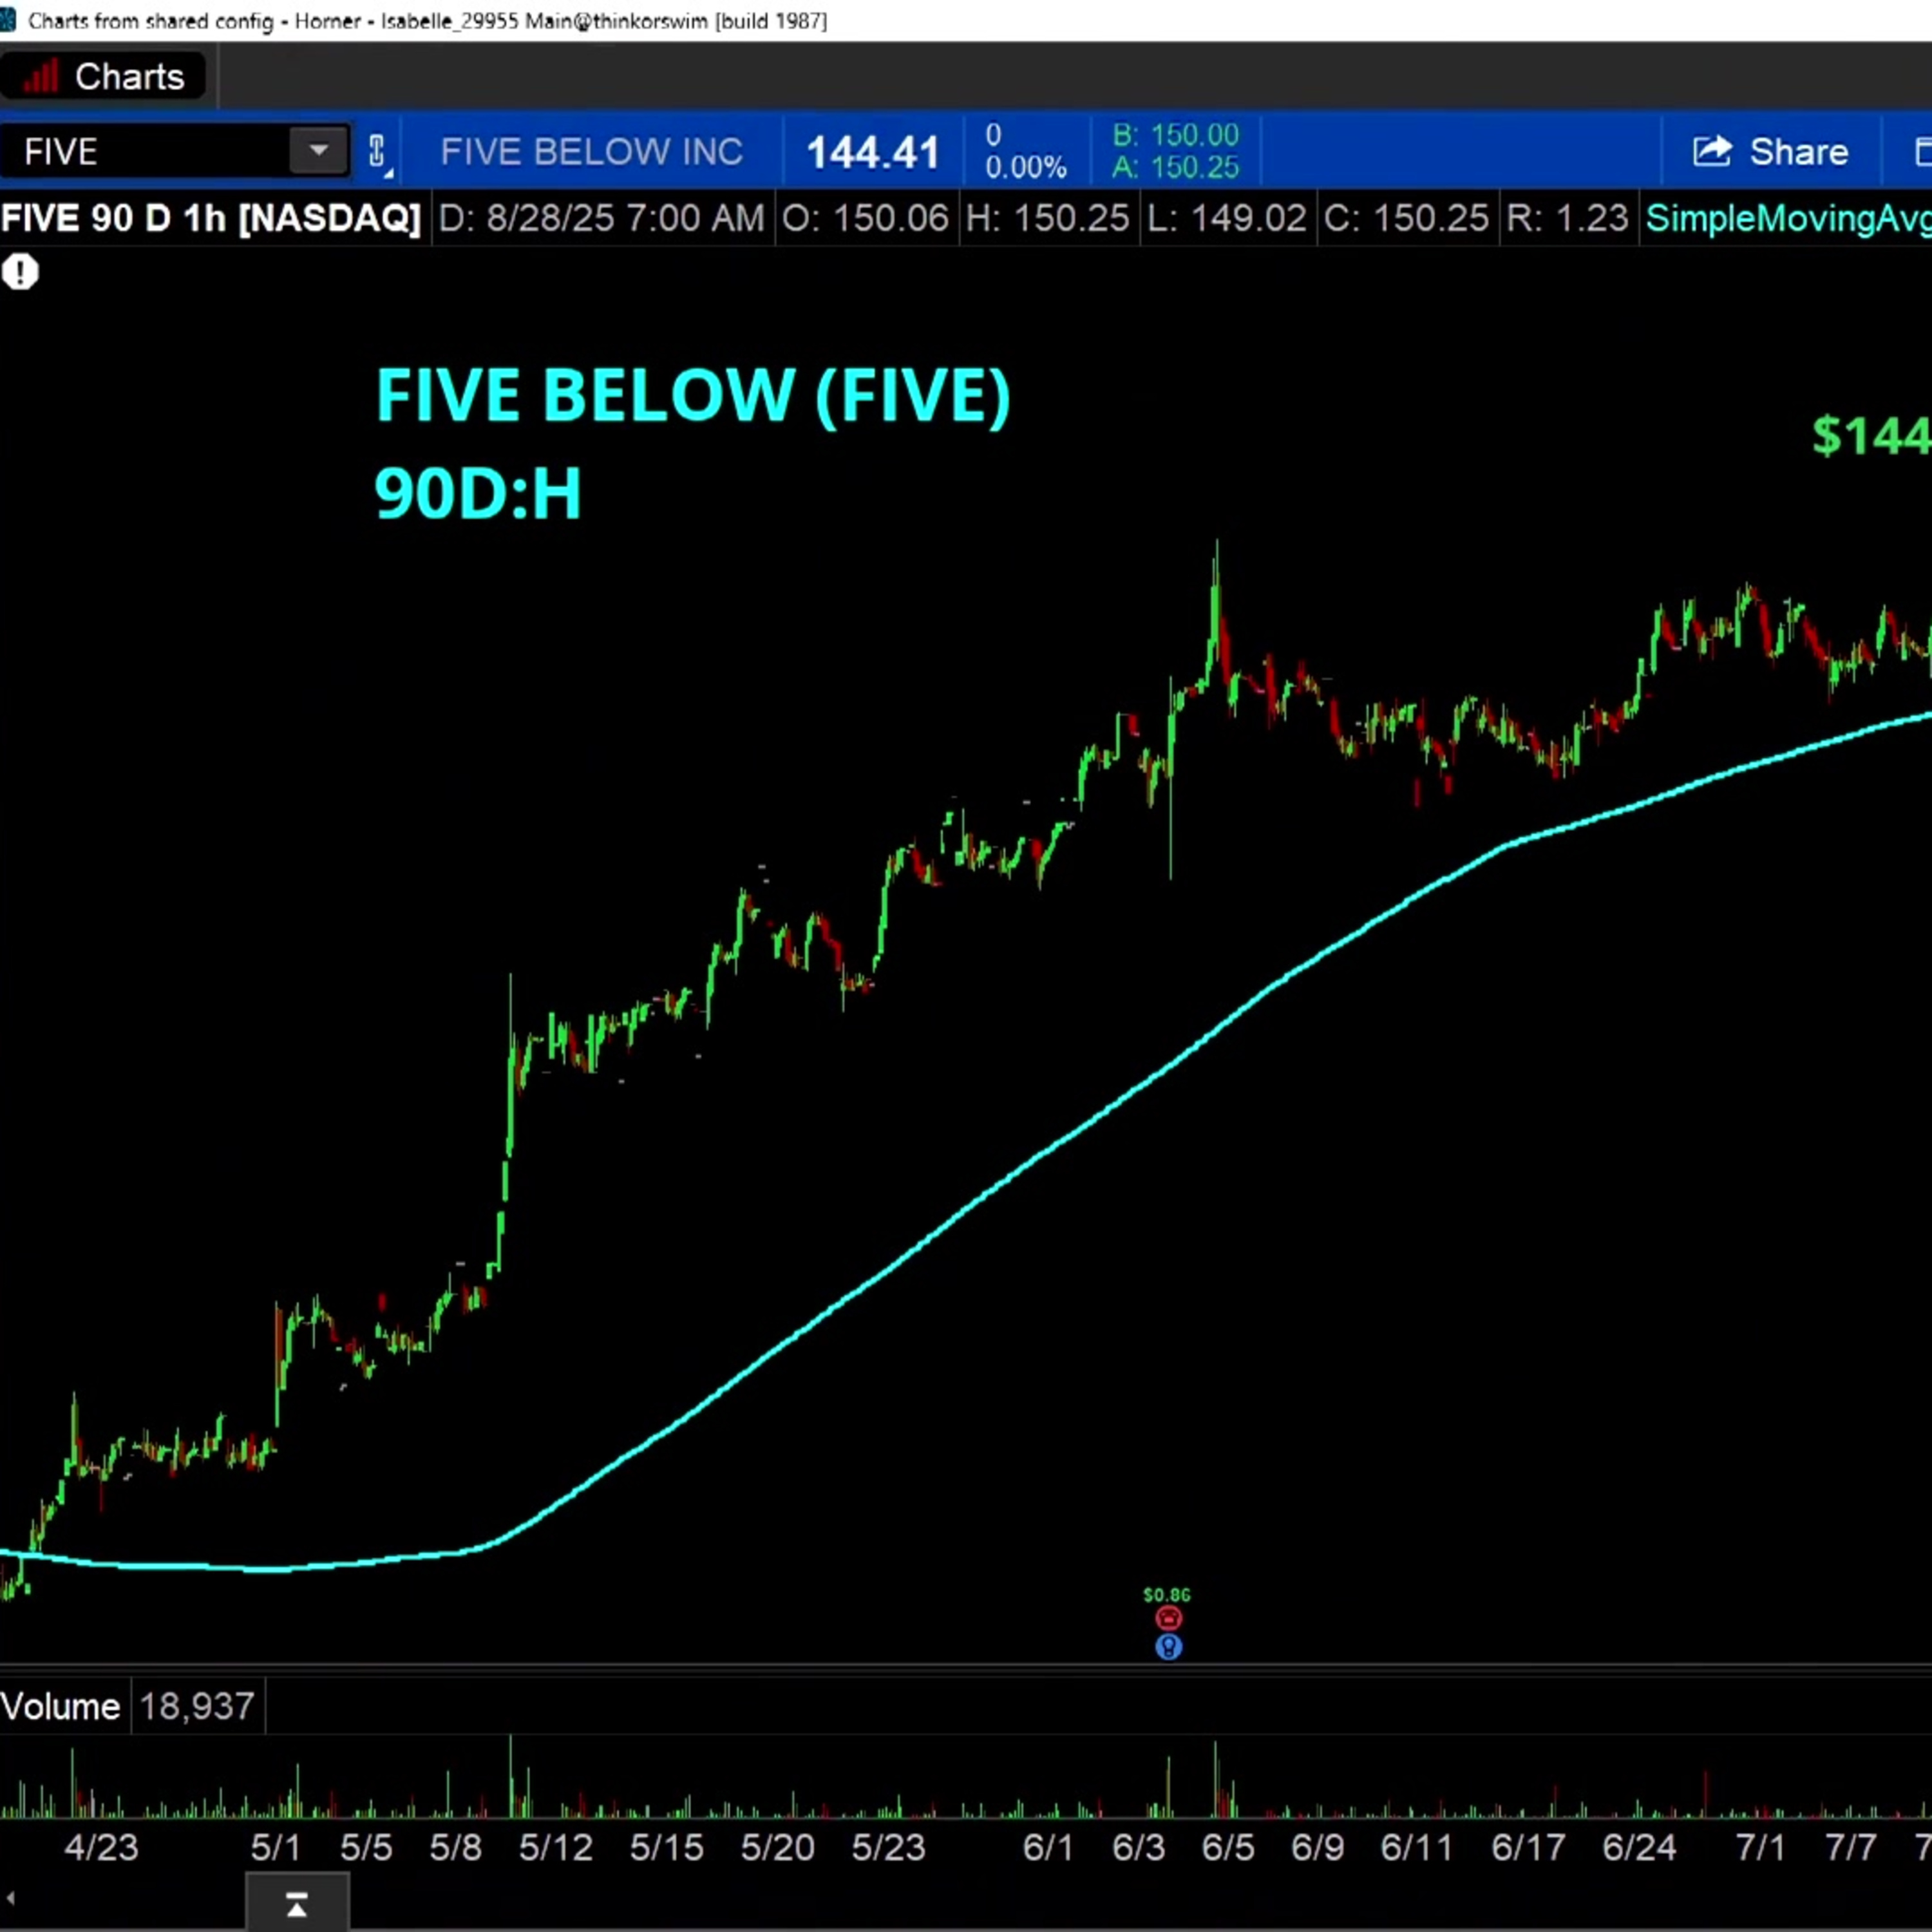
Five Below (FIVE) shares have run higher over the past 3 months, but have been stuck in a near-term range between $131 and $144 says Kevin Horner. He examines the chart after the retailer's latest earnings report. On a 2-year chart, he highlights a recent "golden cross" pattern occurring with its 50-day and 200-day simple moving averages. Five Below reported a top and bottom line beat in its 2Q report.
======== Schwab Network ========
Empowering every investor and trader, every market day.
Subscribe to the Market Minute newsletter - https://schwabnetwork.com/subscribe
Download the iOS app - https://apps.apple.com/us/app/schwab-network/id1460719185
Download the Amazon Fire Tv App - https://www.amazon.com/TD-Ameritrade-Network/dp/B07KRD76C7
Watch on Sling - https://watch.sling.com/1/asset/191928615bd8d47686f94682aefaa007/watch
Watch on Vizio - https://www.vizio.com/en/watchfreeplus-explore
Watch on DistroTV - https://www.distro.tv/live/schwab-network/
Follow us on X – / schwabnetwork
Follow us on Facebook – / schwabnetwork
Follow us on LinkedIn - / schwab-network
About Schwab Network - https://schwabnetwork.com/about