
Chaos Computer Club - archive feed
21,276 episodes — Page 267 of 426
EO Services: From Research to Business (foss4g2019)
Content of the European Association of Remote Sensing Companies: 1. About EARSC 2. The Value in Earth Observations 3. Supporting Businesses - The “Research to Business” Solution 4. Open Source Initiative 5. EARSC in the Region None about this event: https://talks.2019.foss4g.org/bucharest/talk/SLNK39/
Using Open Street Mapping to map Incidence of Malaria among Vulnerable People of Luano District, central Zambia (foss4g2019)
Using Open Street Mapping to map Incidence of Malaria among Vulnerable People of Luano District, central Zambia This is a Research project for the YouthMappers. This study investigates the incidence of malaria among the vulnerable people living in a remote area of Zambia. Since the area is prone to flooding, the incidence of malaria is very high. The study will use ODK a mobile based data application to collect data and QGIS to analyze the data. The study is important because the data that will be collected will be useful to the Ministry of Health and other organizations that have interest in community health and human security. The all research project is based on the open street map. This Research has 3 focusing objectives as follows’ (a) Map the incidence of malaria in Luano district using Open Street Mapping techniques. (b) Determining the burden of malaria epidemics in the area. (c) Determine the impact of the incidence of malaria on the socio-economic wellbeing of the people in the area. None about this event: https://talks.2019.foss4g.org/bucharest/talk/DQP7QK/
BruGIS Data Management (BDM) : QGIS plugins to manage and edit data (foss4g2019)
BruGIS® is a cartographic tool developed by a public interest organization (Urban.brussels) and used for the management and planning of the territory in the Brussels Capital Region. BruGIS Data Management is a QGIS client to update spatial data published on the BruGIS platform. Implemented with Open Source technologies (QGIS, GeoServer, Django, Python, etc.) it provides a centralized, uniform and exclusive way to edit spatial data online. After a short overview of the architecture, we’ll focus on the demo of QGIS client using 2 plugins (admin and user). We’ll be able to create a new user and assign him editing rights on a layer. Then edit the layer allowed, modify, validate (topological) and finally submit it. Lastly, we’ll publish the modified and validated layer. The path of the modified table will be followed through the DB environment of BruGIS. The organization of data synchronization through the three environments (production, staging, diffusion) will be briefly addressed. The purpose of this demonstration is not to go into the technical details of the production flow but rather to exemplify the use of Open Source technologies within the framework of the daily management of the urban data in a public administration. None about this event: https://talks.2019.foss4g.org/bucharest/talk/T7QHTA/
QWC2 viewer for QGIS server with micro service architecture (foss4g2019)
QWC2 is a responsive web mapping client optimized for publishing maps with QGIS Server. A modular architecute based on micro services (running as Docker containers or WSGI modules) allows scaling from basic setups up to highly customized service environments. None about this event: https://talks.2019.foss4g.org/bucharest/talk/NBMQLT/
OSS Technologies in Modelling Spatial Accessibility of Primary Health Care in Malawi (foss4g2019)
Accessibility to primary health care (PHC) in developing countries is crucial and remains a challenge with conflicting statistics in Malawi. For instance, the Health Sector Strategic Plan II, 2017-2022 reports accessibility at 90 % while the Demographic Health Survey puts it at 56 %. The discrepancies emanate from multiple factors among which is failure to incorporate critical geographic cost factors like elevation, road networks, road conditions, etc. in the estimation models. This study, therefore, seeks to develop a PHC accessibility estimation model that incorporates cost spatial factors of elevation and road network distances using open source software and geospatial routing techniques.The accessibility analysis was evaluated using 2 step floating catchment area (2SFCA) model implemented using PostgreSQL/PostGIS and based on the pgr_dijkstraCost algorithm. The model score was expressed in terms of time of travel assuming walking as the mode of travel with a 1-hour threshold indicating acceptable accessibility. To improve accuracy, the road network data was exploded to 20 m node distances. 2SFCA creates two catchment areas called floats in each step.The first step determines the population falling within a specified cost threshold and the facility population ratio. In the second, for each household, the model determines services available within the specified cost threshold at facilities and adds it to the facility population ratio to derive an accessibility score. The 2SFCA score starts from 0 growing boundlessly with 0 indicating households not within the 1-hour threshold. Higher scores indicate access within 1-hour and to multiple facilities or multiple services within an hour or facility respectively.The 2SFCA model result scores ranged from 0 to 0.19, with 100 and 58 % of urban and rural households within 1-hour of a facility (2SFCA > 0) respectively and a district average of 62 %. 70 % of the urban households have access to multiple health facilities (2SFCA > 0.01) as opposed to only 16 % of the rural households. As such the findings provide, arguably, spatially objective PHC accessibility data to inform policy direction and also reveals accessibility to PHC in Malawi to be lower than reported. Besides the evaluation of PHC accessibility, the application of FOSS tools in this study, strengthens the case of their relevance in low resource contexts where computation power and electricity can be intermittent, making it difficult to run models that span multiple days. Using PostgreSQL/PostGIS for relational spatial analysis modeling made it possible to resume modelling after power outages. Thus, the study has successfully demonstrated utility of relational spatial analysis using open source technologies in low resource settings of the developing world. With improved computational capabilities such models can be used for national benchmarking of accessibility and hence provide concrete data on the provision of PHC and other applications None about this event: https://talks.2019.foss4g.org/bucharest/talk/CWT3DA/
Free and Open Meteorological and Climate data - what is missing? (foss4g2019)
Copernicus offers, besides the well-known Sentinel satellite data, a wealth of domain-specific open environmental data sets, e.g. data on climate, wildfires, air quality, floods. One of the most popular data set useful for many environmental applications is the climate reanalysis ERA5 produced from the European Centre for Medium Range Weather Forecasts (ECMWF). Improvements in the spatial and temporal resolutions lead to an increase of the entire data volume up to 5 PBs. Additionally to the sheer amount of data, meteorological and climate data have a certain complexity, especially for “non-expert” users, as data can have up to five dimensions and two time dimensions. The current situation shows that a full, free and open data policy is one important prerequisite, but the key to fully unleash the potential is making the data ‘accessible’. If open data is not accessible, it becomes open data that is locked away in large data silos. However, making meteorological and climate data “accessible” means more than just improving data access. It requires improvements and developments along the entire data processing chain, including the development of example workflows and reproducible training materials as well as developing / enhancing mainstream open-source software tools. In this context, the FOSS4G spirit is vital. This talk puts the spotlight on open meteorological and climate data. Current ‘accessibility’ challenges and future needs will be discussed in order to make open meteorological and climate data better accessible to everyone. None about this event: https://talks.2019.foss4g.org/bucharest/talk/KENHRF/
Urban Geo Big Data (foss4g2019)
Nowadays about 54% of world population lives in urban areas and, according to the 2014 UN-ESA report, this percentage is expected to increase up to 66% by 2050. We are clearly facing a rapid and global trend, that will affect daily life in the next few decades. It is, therefore, crucial to managing this social and cultural change in a much more sustainable way, compared to what was done in the past. Within this framework, the collection, integration, and sharing of reliable and open spatial information is a key factor, benefiting both of different space (Earth Observation (EO) satellites and Global Navigation Satellite Systems (GNSS)) and ground (low-cost devices networked in the Internet of Things (IoT), 50 billion are expected within 2020) technologies. The contribution deals with the general presentation of the Urban Geo Big Data, a collaborative acentric and distributed free and open source platform consisting of local data nodes for data and related service Web deploy, a visualization node for data fruition, a catalog node for data discovery, a CityGML modeler, data-rich viewers based on virtual globes, an INSPIRE metadata management system enriched with quality indicators for each dataset.For data visualization and analysis, a 3D model of the urban environment was created. CityGML is an open standard that has been thoroughly tested in the past years. One of the activities in this project was to create an Extract, Transform and Load (ETL) procedure for converting information from cartographic sources into CityGML at LOD1 (Level of Detail 1). Data are viewable by means of Cesium or Web World Wind depending on the specific examined case. Three use cases in five Italian cities (Turin, Milan, Padua, Rome, and Naples) are examined: 1) urban mobility; 2) land cover and soil consumption at different resolutions; 3) displacement time series. Concerning mobility data and analysis, particular attention has been given to data modeling and processing algorithms with the aim to deliver value-added information enabling standard and innovative services (Origin/Destination matrix, flows checking, routing options, etc.) based also on crowdsourced data. Land cover and soil consumption data derive from semi-automatic classification of Sentinel 1 and 2, integrated with Copernicus land monitoring services at different resolutions and enhanced by photo-interpretation. Several environmental and landscape indicators are assessed at municipal level, exploiting spatial datasets. For displacement, SAR derived time series and the related Web services (WMS, WFS, and WMTS) metadata in RNDT format (the Italian extension of INSPIRE format) are automatically generated thus relieving the data provider from the need to create them manually. Besides the case studies, the architecture of the system and its components will be presented. None about this event: https://talks.2019.foss4g.org/bucharest/talk/8STCNM/
State of GRASS GIS Project: 35 years is nothing! (foss4g2019)
After 35 years of of continuous development, [GRASS GIS](https://grass.osgeo.org/) comes again with great improvements. Being a community-driven project, it offers geospatial analysis, earth observation, time series processing and visualization. It supports large raster files (billions of cells), vector topology, and coupling with SQL databases. In our presentation we'll give an overview of the latest improvements. The algorithms for interpolation, solar radiation, water flow, and sediment transport have been parallelized. Experimental features include concave hull, vector algebra, point cloud import, DEM fusion and blending, object-based classification, Sentinel data processing, and spatio-temporal algebra. Furthermore, pest spread and urban growth modeling are now available. Importantly, Python 3 support has been added. Raster storage now benefits from new ZSTD compression. GRASS GIS supports GDAL up to v2.5 and PROJ up to v6. Easy cloud deployment is offered with ready-to-use docker images and an improved test coverage along with continuous integration. The code development will move to GitHub, including the issues and source code branches since 1987. A new, modern website is on the way, supported by a crowdfunding campaign. None about this event: https://talks.2019.foss4g.org/bucharest/talk/W3LWDV/
Addresscloud: how we built a business on FOSS (foss4g2019)
Having worked with geospatial technology in the insurance industry since 2003 I had my eyes opened to open source at FOSS4G 2013 in Nottingham. I came away excited and energised by what I had seen and it planted the idea for how we could do things differently. 2 years later I quit my day job as a contract solutions architect and took a big pay cut to create Addresscloud, our aim to tackle the complex geocoding challenges faced by UK/I insurers. 3 years on we have gone from strength to strength and are now a profitable, rapidly growing business with a portfolio of customers from startups to FTSE 100 companies. In this talk I will discuss our journey, challenges along the way and our lessons learned. None about this event: https://talks.2019.foss4g.org/bucharest/talk/ZLVQDG/
OGC Overview: programs, processes, standards baseline and new developments relevant for the OSGeo community (foss4g2019)
The coordination of increasingly faster development of geospatial Free and Open Source Software and more longer term oriented standards presents some challenges which have been identified and taken up by key organizations of the domain. OGC and OSGeo have a long history of cooperation, since many years we work together through a Memorandum of Understanding, which amongst other aspects provides OSGeo to a certain extend access to the OGC standards development process. The cooperation is meant to bring in requirements, ideas and expertise from the OSGeo community to the OGC programs and processes and provides the OSGeo community with an insight into the current developments of open standards. The Overview presentation will provide a short insight into the OGC programs and processes and will explain the idea and development approaches for the OGC baseline. It will also talk about the results of various hackathons (OGC API hackathon) and Innovation Program initiatives (e.g. EO Big Data Architecture) that will happen in June and July. It will furthermore give an update on the Future Directions technology trends mapping of OGC and how the OSGeo community can be part of it. None about this event: https://talks.2019.foss4g.org/bucharest/talk/ZPFATH/
Exploratory study of urban resilience in the region of Stuttgart based on OpenStreetMap and literature resilience indicators (foss4g2019)
Training spatio-temporal OSM-indicators based on the resilience core from Cutter (2016) and exploring the implications for urban planning in the light of revealed thematic tags in the region of Stuttgart. “Nobody on this planet is going to be untouched by the impacts of climate change” Rayendra Pachauri (2014) The overarching nature of building resilience across disciplines and its inherent positive mutual understanding due to the association with the immune system, also amongst the non-scientific community, makes it an attractive and increasing popular concept which everybody seems able to grasp its necessity. Hence there is an exponential increase, even limited down to the key words “urban resilience”, in scientific literature over the last decade. Moreover the concept is also taken up by the New Urban Agenda – Habitat III, the SDG goals and also the IPCC. Hand in hand with this development the definitions and operationalizations are innumerable and starting to lay a smoke screen above it. Conjoined, there is a clear lack of validation of resilience measures, including spatio-temporal aspects but also of the single component of it (Bakkensen 2017). Moreover, traditional data sources like census or governmental data miss out on certain important facets making empirical validation impossible and lack the spatio-temporal resolution necessary to cover the characteristics of resilience (Burton 2014). Hence, this experimental study explores and develops new spatial indicators through machine learning methods derived from OpenStreetMap data to replicate conventional core indicators. In order to cover all spatial attributes indicators for points, lines and areas will be deduced and separately as well as in a combined analysis investigated by means of supervised and unsupervised algorithms. The outcome is expected to uncover hidden spatial relations and patterns of urban resilience. Moreover, Burton (2014) stresses the need for new data sources to better understand the multifaceted phenomena of urban resilience. Therefore this study is contributing in developing robust and reliable socio-economic indicators contributing to this challenge to clear up the smoke. None about this event: https://talks.2019.foss4g.org/bucharest/talk/DE77KF/
An open risk index with learning indicators from OSM-tags, developed by machine learning and trained with the WorldRiskIndex (foss4g2019)
Developing learning crowed based spatio-temporal indicators to model the components of the WorldRiskIndex based on OSM tags and machine learning Climate change is already reality in many parts of the world and even more threatening our future well-being. The SDG 1.5 explicitly aims to reduce by 2030 the vulnerability and exposure to climate related hazards. The World Risk Index (WRI) is one well-respected approach in profiling countries risk to natural hazard. To effectively monitor development and detect decision knots on the climate resilience pathway (IPCC 2014) data of high resolution in space and time about the worlds countries is of urgent importance. Hence, the core of this work is the development of learning indicators. Learning in the sense of a methodological approach combining PostGIS for data management, R for statistical learning and QGIS for spatial analysis on crowd based information assessing the OSM-database and addressing the need of societal learning in the face of severe climate change. The World Risk Index (Birkmann et al. 2015) will guide the supervised learning part resulting in an indicator set derived from OSM tags, establishing on one hand an open risk index and adding deep explanatory power to its components by a qualitative discussion of the OSM themes. The second part explores with unsupervised algorithms the inherent characteristic of country groups classified by the open risk index and deduces common patterns of socio-economic vulnerability but also societal resilience. Hence, the inherent challenge of this work is to substitute existing static indicators with new dynamic indicators, but not only substituting them but also painting a more detailed picture. Moreover, new data sources still questioned often by their reliability compared to World Bank or census data, and therefore its opportunities are neglected instead of critically exploring the potential. Therefore, this thorough statistical approach in quantifying uncertainty contributes to the acceptance and hence use of crowd based information adding necessary reliability for policy and planning. This unique combination is not yet done and bares huge potential moreover united with the open source geo community to contribute a little piece of the puzzle for achieving the SDG 1.5. None about this event: https://talks.2019.foss4g.org/bucharest/talk/MGKS9N/
Demystifying AI in Geo (foss4g2019)
You are probably familiar with the terms artificial intelligence (AI), machine learning (ML) and deep learning (DL). However, do you really know how they work with GIS? In this session, we will use Python and various libraries to illustrate how artificial intelligence is used to detect deep and complex spatiotemporal patterns in data, and how to predict geospatial events of interest. This talk will cover several scenarios of applying the latest machine learning and deep learning techniques to geospatial data, including applying object detention using satellite imagery, detecting objects in videos and other workflows to incorporate these data sciences. None about this event: https://talks.2019.foss4g.org/bucharest/talk/JQTVFF/
Using the OGC Web Processing Service (WPS) to move business logic to the server (foss4g2019)
In the past, desktop GIS were necessary to handle complex spatial business decisions. This lead to problems with data management, model updates and an increased cost to the organisation in hardware and (often) software maintenance. As organisations move to more cloud based solutions and provide staff with thinner client machines (chrome books etc.) it becomes harder for staff to manage more complex geospatial problems. The Open Geospatial Consortium (OGC) developed the web processing service (WPS) standard in 2005. It provides rules for standardizing how inputs and outputs (requests and responses) for geospatial processing services are made. The standard also defines how a client can request the execution of a process, and how the output from the process is handled. It defines an interface that facilitates the publishing of geospatial processes and clients’ discovery of and binding to those processes. This talk will present case studies of how Astun Technology has used the OGC WPS standard, as implemented by GeoServer, to allow users of web based mapping applications to carry out advanced spatial operations and allowed them to implement complex business logic without the need for specialised hardware or software. None about this event: https://talks.2019.foss4g.org/bucharest/talk/VL8H7Q/
WPS with Qgis processing - From desktop to server (foss4g2019)
We will discuss the implementation of a full featured WPS service built upon the Qgis processing toolbox. From this, we will show how we can use the algorithms managed from the desktop Qgis directly on a serveur backend. Will we show use case from the context of a deforestation study that uses processing models to make projection of future deforestation states. The results of the model are then used from server side to expose maps and indicators to decision makers. None about this event: https://talks.2019.foss4g.org/bucharest/talk/NQUTWS/
Social protection portal Kampala - On open source portal for humanitarian use (foss4g2019)
In close collaboration with UNICEF Uganda and GeoGecko, KCCA spearheaded the development of an online open source portal to provide a visual presentation of key social services available in Kampala. The tool is built on the backbone of four pillars aimed at (i) identifying key partners’ operations and the nature of their engagement in Kampala, (ii) mapping infrastructure points designed to deliver predetermined services (e.g. schools), (iii) summarizing parish level specific socio-economic profiles, and ultimately (iv) offer insight into the lives of young Ugandan adolescent girls accessing such service in Uganda’s capital city. The tool is built with Open Source tools and can therefore easily be adopted to other projects, regions and be implemented in another context. During this presentation we will (i) walk through the portal and explain how it is created, (ii) describe how it is currently used, and most importantly (iii) discuss how it can be improved and adapted to other sectors at scale. None about this event: https://talks.2019.foss4g.org/bucharest/talk/EFBK9U/
State of PyWPS (foss4g2019)
PyWPS is an open source, light-weight, Python based, implementation of the OGC Web Processing Service (WPS) standard. It provides users with a relatively seamless environment where to code geo-spatial functions and models that are readily exposed to the Internet through the WWW. Initially started in 2006, the current 4.x version takes advantage of the state-of-the-art Python infrastructure in order to provide new and useful features. The current version implements the WPS 1.0 standard entirely. The WPS 2.0.0 and it's features is currently on-hold status. PyWPS offers a straightforward WPS development framework with the increasingly popular Python language. Python offers access to a vast array of code libraries that can be easily used in the processes, in particular those for geo-spatial data manipulation, e.g. GRASS, GDAL/OGR, Fiona, Shapely, etc., but also to statistics packages (e.g. rpy2 for R statistics) and data analysis tools (e.g. pandas). PyWPS offers storage mechanisms for process inputs and outputs and spawns processes to the background for asynchronous execution requests. Talk will present features of the last 12 months of development and outline the roadmap for next versions of PyWPS. None about this event: https://talks.2019.foss4g.org/bucharest/talk/NLVSZJ/
GeoNetwork Opensource: What’s Happening and Upcoming (foss4g2019)
The GeoNetwork Opensource project has been an OSGeo project since a decade. It is a catalog application facilitating discovery of resources within any local, regional, national or global SDI. Users can register their spatial datasets, services, maps, sensors in a central catalog. Others can query the catalog to find resources via the website or directly from a GIS application, like GeoNode or QGIS. The catalog records can also be ingested by other catalogs and search engines to facilitate wider discovery. In this presentation the core developers introduce you to recent developments in the community. GeoNetwork adopted a twice-a-year lifecycle, so we’ve released the 3.6 and 3.8 version which had some interesting new features like metadata workflow, history, INSPIRE metadata guidelines 2.0, DOI, user searches, json and json-ld encodings, inline validation, WFS 2 and 19115-3:2018. Currently we’re in a major refactor to migrate the catalog to use ElasticSearch as a base search index for the 4.0 version. None about this event: https://talks.2019.foss4g.org/bucharest/talk/TAZLUJ/
Metadata workflow, history and draft in GeoNetwork (foss4g2019)
SDI's typically have a challenge of a data publication requiring a review phase before becoming approved and accessible. It is relevant for each aspect of data publication; data, transformations, service and metadata. The review phase should be as complete as possible (including INSPIRE/OGC/QOS validation) so there will be no surprises when making the resource widely available. GeoNetwork has had a workflow module to allow users to review a record before it becoming public for a long time, however the functionality was a bit hidden and had some challenges. This summer we're landing a 5 years old feature branch in GeoNetwork to improve this aspect of the application. The workflow, if configured, is brought more upfront and a mechanism has been added to allow to work in a draft version, before the approved copy is replaced. This branch has been extensively tested by some of our users in recent years. From their experiences we’ll highlight some of the additional benefits of this module. The workflow mechanism can also be used to trigger publication of datasets in external components, such as Docker or GeoServer. None about this event: https://talks.2019.foss4g.org/bucharest/talk/QSGRZW/
Designing for Crisis (foss4g2019)
Ushahidi designers have been investigating what makes communities strong, resilient and what empowers them to feel like they are an integral and valued part of a whole. Building on a research led hypothesis, that more communicative and integrated communities fair better and recover faster when disasters like hurricanes, floods and terrorist attacks hit, we are building upon this statement from users: “We want to help people in a crisis and be helped back from our own” Now the Ushahidi product design team are finding a way to foster connections between people to help each other in little ways using technology and innovative processes like Machine learning, automatic systems and digital social trust, then we believe that we can create more of these resilient communities world wide. We’ll cover our recent in-depth field study in Nairobi communities and our wider community research worldwide. From Government services, Ambulance and Police to lesser known organisations like urban search and rescue (USR), SARAID, Team Rubicon and The Red Cross and then on to the communities of regular people that are supported b services and organisations and how they participate in the safety and growth of their communities None about this event: https://talks.2019.foss4g.org/bucharest/talk/B8D779/
Are we going back to Command Line GIS ? (foss4g2019)
After 05:00 the audio from the speaker is masked by audio from the video that is playing. In the early ages of Computer Science, there was only Command Line Interface (CLI). No mouse, no windows. But computers was already able to do more than just calculus. First of this kind -- in the early eighties ! -- GRASS GIS was able to manipulate, analyze and visualize geospatial data. All in CLI. But it was frightening for most users. CLI is terrifying. Then graphical interfaces arrived with windows and mouses. Computers started to be cheaper and more affordable. Almost everyone now can own and use a computer. With a graphical interface. Less scary, more accessible. And GIS followed the trend. ESRI created ArcMap, QGIS was born. Even GRASS GIS got a Graphical User Interface at some point. But isn't CLI making a come back ? Quietly ? Even in our small geospatial heaven ? Let's have a look at behind the curtain and see what CLI can offer nowadays with the Python and R datascience stacks. Let's look at CLI GIS, right in the eye ! By the end of the talk audience members will : * not be afraid of CLI anymore (let's hope) * might want to learn a scripting language and explore console mode * want to combine best of both worlds None about this event: https://talks.2019.foss4g.org/bucharest/talk/DKL3EW/
Taking community mapping to a new level (literally) in Tanzania (foss4g2019)
Community mapping efforts in Dar Es Salaam are enabling local leaders to leverage information about the most granular level of community administration that exists in Tanzania. Originally intended to demarcate 10 households (ten-cell boundaries), these "shina" boundaries now encompass hundreds of households in informal settlements and are already being used by one of Dar's largest hospitals to track patients' origins at an unprecedented resolution. None about this event: https://talks.2019.foss4g.org/bucharest/talk/NHW3BM/
Mapping the world beyond Web Mercator (foss4g2019)
Most popular mapping presentations today, ranging from clients to servers, show and discuss only maps in web mercator, the popular Mercator derived projection used by OSM as well as most commercial tiles providers. There is however an interesting, exciting world of map projections out there, that are still being used in a variety of context. This presentation will introduce the advancement made in GeoTools and GeoServer to handle those use cases, where users have a worldwide data set, and need to view all or part of it in multiple projections, some of which valid in a limited area, and requiring the software to perform a proper display of it on the fly, without any preparation. We’ll discuss GeoTools/GeoServer “advanced projection handling” manages to deal with these cases, wrapping data, dealing with the poles and the dateline, cutting on the fly excess data, densifying on the fly long lines as needed to ensure a smooth reprojection, for a variety of cases, ranging from seemingly innocuous datum shifts, maps having the prime meridian over the pacific, and the various tricks to properly handle stereographic, transverse mercator, Lambert conic and other limited area projections against world wide source data sets. None about this event: https://talks.2019.foss4g.org/bucharest/talk/DHDH7C/
Geodata on IPFS (foss4g2019)
Storing and distributing large data sets is still challenging. There are issues like corrupted files, bandwidth limitations or just unreliable networks. This talk is an introduction into peer-to-peer technologies and [IPFS]. You will learn how these technologies can help you with the previously mentioned problems and why it is a great fit for your geodata. Such a peer-to-peer network doesn't necessarily need to be a public one, everyone can participate in, it may also be used to distribute the data between trusted parties. Currently, there is a Go and a JavaScript implementation — that even runs in the Browser — of IPFS available. IPFS is fully open source and licensed under the MIT Licence (soon MIT+Apache2 dual licence). [IPFS]: https://ipfs.io/ None about this event: https://talks.2019.foss4g.org/bucharest/talk/QPKWUB/
Shortest path in the database and more with pgRouting (foss4g2019)
pgRouting extends the PostGIS / PostgreSQL geospatial database to provide shortest path search and other network analysis functionality. This presentation will show the inside and current state of the pgRouting development, from its wide range of shortest path search algorithms and other algorithms like driving distance calculation or “Traveling Sales Person” (TSP) optimization, graph contraction, flow analysis etc. Additionally we will give a brief outlook and introduction of upcoming new features on the version 3.0. We will explain how the data structure is important to get better routing results. Furthermore we will show how you can improve the quality of the search with dynamic costs and make the result look closer to the reality. You will also learn about difficulties and limitations of the library, and when pgRouting might not be not the right tool to solve your routing problem. Links to project: https://github.com/pgrouting/pgrouting None about this event: https://talks.2019.foss4g.org/bucharest/talk/7WKUZY/
Cesium applications made awesome with TerriaJS (foss4g2019)
CesiumJS is a fantastic library for 3D geospatial visualization on the web, but it can be a huge amount of work to build a full-featured application on top of it. Enter TerriaJS. It builds on top of CesiumJS - and is released under the same open-source license - while adding a responsive UI for exploring a catalog of datasets, charts and graphs, a "splitter" interactive comparison tool, automatic region mapping from CSV files, hooks to geoprocessing services, shareable story building, a 2D fallback based on Leaflet, and much more. In this talk we’ll discover many of the advantages of using TerriaJS while exploring how we used open source and open standards to create the NSW Digital Twin Proof of Concept, a catalog and viewer of 3D datasets integrating live transport data, infrastructure (above and below ground), building information models, and cadastral data. TerriaJS also underpins multiple other major projects developed by CSIRO’s Data61 including Australia’s nationalmap.gov.au and the Global Risk Map - built for the United Nations Principles for Sustainable Insurance Initiative. TerriaJS is widely utilised by independent map publishers with an active chat community on gitter.im and more than 450 GitHub stars. None about this event: https://talks.2019.foss4g.org/bucharest/talk/EJ9ZGE/
SpaceNet: Automation Levels for Foundational Mapping (foss4g2019)
There has been an explosion of research into computer vision focused on deep learning. These significant advances in image classification, object detection and image segmentation have profound implications for foundational mapping applications. Recent open source initiatives such as SpaceNet have strived to direct more research and development towards remote sensing applications. GIS practitioners need to understand and engage the research community to help structure the application of these new techniques against geospatial problems. tt is difficult translate mission requirements to machine learning evaluation metrics, and vice versa. For example, in the computer vision community, most results are described by certain image specific metrics such as mAP, F1Score, Precision and Recall. Alternatively, a GIS practitioner may want to incorporate machine learning capabilities into their workflow, but not know what level of performance is necessary for the specific mission. We will discuss a framework for defining levels of practitioners augmentation that will allow end-user groups and machine learning researchers to better understand each other and help direct the application of these advanced algorithms against geospatial problems. None about this event: https://talks.2019.foss4g.org/bucharest/talk/N8R8UX/
Visualization of Big GeoData: An experiment with DINSAR deformation time series (foss4g2019)
Big Geo Data (BGD) constitute a challenge for monitoring and assessing the status of and changes in the natural and in the built environment where most of the people live. Nevertheless, to convert BGD into value, we need to fill the gap existing between the current form in which BGD are represented, which conveys information understandable to scientists and experts, and the needs of not experts, decision and policy makers who could exploit information derived of BGD if adequately summarised and explicitly visualised. To this end, new methods are needed for the discovery of the relevant geodata among huge repositories, the assessment of the geodata quality, and, finally, the synthesis of BGD to provide decision makers with consistent and comprehensible information to possibly discover hidden knowledge. Within the project “URBAN GEOmatics for Bulk data Generation, Data Assessment and Technology Awareness (URBAN GEO BIG DATA)” we are experimenting the definition and application of novel technological solutions for fostering the fruiting and synthesis of BGD by public administrators and the citizens of urban areas. Specifically, the project aims to improve the knowledge of urban areas by exploiting the fruition of the vast availability of EO data sources for soil consumption and long-term monitoring, and IoT data on mobility. A key aspect concerns the definition and implementation of novel methods for geo data dissemination through the application and extension of standard interoperable sharing protocols. In this paper, we focus on the experiments aimed at fostering the fruition of ground deformation time series derived through the Differential SAR Interferometry (DInSAR) measurements, in urban areas (i.e., Naples and Milan city areas). In particular, the Small BAseline Subset (SBAS) technique has been applied to generate DInSAR BGD displacement time series which can be served directly by applying OGC WMS and WFS requests, but the results achieved can be hardly interpretable by non-expert decision makers. To empower their potential fruition, we defined and implemented an automatic mechanism aimed at generating a qualitative visual temporal animation of the BGD time series of deformation synthetized by snapshot maps, generated with a reduced spatial and temporal resolution. They can be helpful for a non-expert to visually identifying at a glance the areas subject to deformations, without spending much of time analysing the single deformation time series. Useful knowledge is the mean deformation velocity map of the analysed areas. However, to follow the time evolution of the deformation, we have selected merely one single measurement per year. This is only a qualitative method for helping non-experts in identifying areas with large deformations. The paper will focus on this aspect describing its implementation details and characteristics. None about this event: https://talks.2019.foss4g.org/bucharest/talk/3BRATM/
Struggle with WebGL to render vector data (foss4g2019)
Spatial information and its treatment has evolved from the centralization and publication of this in a single repository via standards such as WMS to the service of the information as it is to be processed by browsers via WFS. However, the WFS protocol has some shortcomings in terms of performance when it comes to the format in which to serve the information, giving way to more optimal formats for the service of vector information such as .pbf. This format allows the transmission of large amounts of information to the local browser client. This information, increasingly larger, requires the use of specific rendering libraries such as WebGL. The present work shows a state of the art of the existing WebGL libraries and a real test field on which the data have been tested, showing the results obtained and the most optimal solution. The following frameworks have been considered for the representation of large amounts of data: * OpenLayers * Mapbox GL js * Deck GL * kepler.gl Resulting on the tests executed to represent large amount of data, Mapbox GL has revealed as the more flexible tools in terms of performance and capabilities. None about this event: https://talks.2019.foss4g.org/bucharest/talk/YVGPTY/
Open Science, Knowledge Sharing and Reproducibility as Drivers for the Adoption of FOSS4G in Environmental Research (foss4g2019)
EnviDat is the institutional data portal and publication data repository of the Swiss Federal Research Institute WSL. EnviDat actively implements the FAIR (Findability, Accessibility, Interoperability and Reusability) principles and provides a range of services in the area of research data management that were extensively described in [Iosifescu et al. (2018a)](https://doi.org/10.5334/dsj-2018-028). We continuously improve various aspects of open science support in EnviDat, including implementation of Jupyter Notebooks as documented in [Iosifescu et al. (2018b)](https://doi.org/10.7287/peerj.preprints.27211), thus improving the current situation defined by a “replication crisis”. In [Iosifescu et al. (2015)](http://hdl.handle.net/2263/49954) we have presented several reasons for the increasing adoption of FOSS4G (free and open source software for geoinformatics) in academic research: not only the total cost of ownership, but also the growing stability and maturity of the recent open source software packages, the faster bug-fixing turnover, the increasing availability of professional support, and the flexibility to change and repurpose the open software to tackle new research challenges, among others. These reasons are still valid today, and consequently EnviDat trusts PostgreSQL/PostGIS and Apache Solr with the management of its spatial meta(data). In this contribution, we discuss two novel drivers for the adoption of FOSS(4G) in environmental research: open science and reproducibility. Independent research replication at peer-review is facilitated by the immediate availability of the free and open source software, the absence of software licensing issues and the openness of the code even for older versions of a software. Moreover, researchers producing their own FOSS code can expect a wider distribution of the produced software. In EnviDat, open science support is supported by the combined publication of bundles of datasets and software as for example [Fraefel (2018)](https://doi.org/10.16904/envidat.49) or purely FOSS4G software as for example [Bont (2018)]( https://doi.org/10.16904/envidat.software.1). While Fraefel shows how scientists can complement data publication with additional analysis workflows, the work of Bont demonstrates the opening of a methodology for optimizing the geometric layout cable roads and makes it available for everyone as a plugin for QGIS. In conclusion, supporting reproducibility of research in a portal such as EnviDat is a complex issue that can be simplified by the adoption of FOSS(4G). We would like to stress that reproducibility in science also consists of the transparency of methods and the precise documentation of all steps needed to achieve the published results. In these processes, open source software can play a key role. None about this event: https://talks.2019.foss4g.org/bucharest/talk/ZV8QNK/
GNOSIS Map Tiles: Open specifications for tiles of vector, imagery, coverages, point clouds, referenced and embedded 3D models (foss4g2019)
An overview of the GNOSIS Map Tiles (GMTs) open specifications for tiling geospatial data developed by Ecere in conjunction with OGC Testbed 13 and 14 and the latest draft specifications can be found in OGC Engineering Report: http://docs.opengeospatial.org/per/18-025.html#GMTSpecs GMTs can contain different types of data such as vector data, satellite imagery, coverages/elevation models, point clouds and either embedded or referenced 3D models (e.g. using Ecere's E3D format, or another encoding such as glTF for example). GMTs are compact, ensure proper vector topology, and minimizes the time required to load onto GPU for hardware accelerated rendering. None about this event: https://talks.2019.foss4g.org/bucharest/talk/TSUBJX/
Destination Unknown: Design Dimensions of Open Source Travel Mapping Tools (foss4g2019)
<p>How can interactive maps help people plan great travel experiences? Destination travel is a popular way to experience the world for millions of people. Until now, little research has been conducted to establish what this type of user might actually need in a map-centric application. Most current approaches do not emphasize the role of space and place in travel preparation to help users understand the spatial dimensions of their travel plans. In addition, most of the available trip planning systems are proprietary in nature. Our work seeks to develop an application that goes beyond providing support for simple itinerary creation. We present results from a user survey to assess key spatially-supported travel task needs and design preferences. This data helps characterize the core functional needs for a FOSS web-GIS application and accompanying user interface designed specifically for destination travelers. None</p> about this event: https://talks.2019.foss4g.org/bucharest/talk/RHRGJE/
Database Transformation, Cadastre Automatic Data Processing in QGIS and Implementation in Web GIS (foss4g2019)
On a judicial basis of § 196 Baugesetzbuch (BauGB, 2018) every municipality in the Republic of Germany must publish standard land values in €/m² for the whole district area in a biennial cycle. The standard land values have to be derived comprehensively for different land use within a district. These are mainly residential areas, mixed-use zones (residential and commercial areas), industrial areas, cropland, grassland and forestry. The standard land values serve the taxation authorities to rate the hereditary real estate and also will play a major role for the future property tax (Löhr, 2018). With the help of Geographic Information Systems (GIS) all the necessary data for the derivation of the standard land values could be analyzed. This data consists of cadastral information (ALKIS) (AdV, 2005) for each municipality district like streets, buildings, land parcels, land development plans as well as geocoded data (Bill, 2016) about real estate transactions. According to the INSPIRE (Infrastructure for Spatial Information in Europe) directive (European Parliament, 2007) which aims to create a European spatial data infrastructure for a transparent common environmental policy the geodata representing the standard land values will be provided in the Web with services to query, visualize and download the datasets. The following work contributes to both requirements, the statutory determination of the standard land values answering the lawful necessity and the setting up of the generated geodata in the Web according to the demanded transparency of the INSPIRE directive. This thesis describes the development of automatizing the process of implementing, selecting, aggregating and layouting the relevant objects of the ALKIS data in an Open Source GIS (QGIS) via Python language. The standard land values will be visualized and presented in Web GIS (Seip et al, 2017). Therefore three different Web Clients will be compared according to performance and editing capabilities: QGIS Web Client (Open Source), Lizmap (Open Source) and ArcGIS Online (commercial). Additionally the two different Web GIS server solutions, QGIS Server and ArcGIS Online, will be described and evaluated. None about this event: https://talks.2019.foss4g.org/bucharest/talk/33E8GR/
The FOSS4G Journey (foss4g2019)
Open geospatial is an amazing journey. Join GeoCat in a look at what makes this community great, and the new opportunities for open source to thrive. We also have an important project announcement to share. None about this event: https://talks.2019.foss4g.org/bucharest/talk/RGUPRH/
Create Web Application with Mapbender (foss4g2019)
Mapbender is a content management system for geospatial data services and map applications. With Mapbender you can create applications without writing a single line of code. Mapbender is a flexible client for OGC services. Mapbender is based on Symfony, JQuery and OpenLayers. Mapbender is based on the frameworks Symfony, JQuery and OpenLayers. Mapbender has an administration web interface to do all the work or if you prefer YAML you can configure applications via YAML-file. Mapbender helps you to set up a repository for your OWS Services and to create individual applications for different user needs. An application can provide search modules, digitizer functionality, print & more. You have access control and can provide applications for defined users and groups. This presentation will give an introduction on Mapbender and the possibilities. None about this event: https://talks.2019.foss4g.org/bucharest/talk/WZXZNQ/
Users management, authorization and usage analysis on Croatian SGA Geoportal (foss4g2019)
After initial deployment of Croatian SGA Geoportal, it made a great impact on the usage of GIS viewer and OGC web services in the country. After a few thoushands registered users, it's time to analyze who is using it and how much. Also, there was a need for the administrators to be able to have reported on usage, and to deal with users and groups authorization roles. We achieved this with the combination of proven solutions such as GeoServer, Geofence and custom code. None about this event: https://talks.2019.foss4g.org/bucharest/talk/PTFHWJ/
Offline viewing and editing Geographic Information for Forest Fire Defense (foss4g2019)
As part of the Open DFCI project: Geographic Information Portal for the Defense of Forests Against Fires, the Entente Valabre for the Mediterranean forest wished to put in place a solution of offline viewing and editing geographic information. We will presents the context: OpenDFCI web portal based on Lizmap, the firemen needs, the Geoppopy choice: Raspberry Pi Standalone WebGIS Server, and the realisation. None about this event: https://talks.2019.foss4g.org/bucharest/talk/8QMRMK/
Discover huge raster files in the Browser with geotiff.js (foss4g2019)
Although always a popular format, with the recent specification of Cloud Optimized GeoTIFFs, the TIFF format has had a renaissance as a cloud enabled storage format. Traditional processing software like GDAL took advantage of that, but is not available for browsers and had to rely on server-side processing instead. The geotiff.js library provides a pure JavaScript implementation of the TIFF format and allows the efficient exploitation of large raster datasets with the full range of values and metadata. In this talk, the architecture and techniques used that makes geotiff.js access so efficient will be explained. Additionally recent additional functionalities and developments by growing community will be highlighted. The COG-explorer is a demo application to show the capabilities of geotiff.js by allowing to browse TIFF files on top of an OpenLayers map. It allows to access large TIFF files on remote sources and can combine multiple files and rendering mechanisms to generate visually impressive images. It provides advanced and efficient rendering techniques using WebGL and takes full advantage of the layout of cloud optimized GeoTIFFs and the capabilities of geotiff.js. None about this event: https://talks.2019.foss4g.org/bucharest/talk/UQVC9Q/
Field data collection strategies - using QField and QGIS (foss4g2019)
After collecting data on the field, it needs to be brought back to the office for analysis, visualization and archiving. Depending on the amount of field workers involved and the complexity of your geo data infrastructure, different approaches need to be taken for an optimized workflow. In this talk, you will join Maya the beekeeper along with her friends from different organizations on their journey to collect and integrate data. From a one person biological survey office to an enterprise level asset management company with hundreds of field workers collecting in parallel, this talk will give you the basics to get started. None about this event: https://talks.2019.foss4g.org/bucharest/talk/DTRTNQ/
QGIS: No more plugins only processings (foss4g2019)
With QGIS 3 and the processing module refactoring, it is easiest to add tools without the complexity of plugins. We will discuss the way to add algorithms in python to QGIS and the advantage of using processing. We will also discuss the limit and future of processing modules. As described by Victor Olaya in 2016 during the 2nd International QGIS Conference, all the QGIS tools should be algorithms. None about this event: https://talks.2019.foss4g.org/bucharest/talk/YLFXEV/
EOxCloudless: Level-3 Analysis Ready Satellite Data (foss4g2019)
Having an enormous amount of data available can be difficult to handle. At EOX among other things we create global satellite basemaps (https://s2maps.eu), therefore we understand that saving resources increases reliability of any tool, product or data. While working on the basemaps we found out we can derive new products for our customers: multispectral cloud free mosaics (https://cloudless.eox.at). Usually, a user is confronted with a large number of single scenes or products with varying degrees of quality and cloud coverage. To make this first step of using EO data easier a good extraction method and data bundling becomes more and more important to make it easier to access Earth observation data without having to dig through the archives. Such dissemination options allow everyone to easily access large datasets which are reduced and prepared for instant analysis, machine learning, validation, etc. There are some guidelines which try to define analysis ready data (ARD), however with no clear definition at hand. We are utilizing the experience we have gathered while working closely with our customers. These range from scientists, industry and various national agencies. Every single one of these have their own specifications and None about this event: https://talks.2019.foss4g.org/bucharest/talk/PAF9UH/
From proprietary GIS to OpenSource : overview of a software stack (foss4g2019)
The GIS market evolves at a fast rate. OpenSource GIS solutions have a much stronger maturity now than a few years back. We see a global trend with big companies modernizing their IT and their GIS solutions, seriously evaluating OpenSource GIS compared to their former proprietary softwares, and launching migration plans. OpenSource solutions often come as independant components though, sometimes making it difficult to comprehend the best way to build a full-featured and coherent stack. While we do not pretend to have the best solution for all, in this presentation we detail a proposal for a full GIS infrastructure. PostGIS and QGIS at are the core of this stack, and it covers a wide range of needs for end-users : desktop, web, mobile… Come and realize that yes, you too can migrate to FOSS4G ! None about this event: https://talks.2019.foss4g.org/bucharest/talk/NZYXPN/
Real time mapping with SMS where there is no internet (foss4g2019)
In the Sahel, the survival of pastoral and transhumant communities depends directly on the access to water and pasture for their livestock. The availability of these resources is mostly influenced by the erratic rainfall conditions that characterize the Sahelian climate. To reduce the vulnerability to critical events, pastoral communities need access to reliable information on pasture, water, climate, animals’ concentration and disease outbreaks. As they live and move in areas with poor to no internet connection, Action Against Hunger (ACF) developed a system where data is collected from herders using a Telerivet SMS gateway and stored in a cloud environment. An automated script then geocodes the responses and creates a shapefile for each survey, ready to be plugged into QGIS for analysis. Currently 109 focal point nomadic herdsmen are spread over 4 Sahelian countries (Mali, Burkina Faso, Senegal and Niger) to collect and inform more than 18 core indicators on the pastoral situation. Cartographic data is then published on a public and open source web platform and transmitted to herders through radio broadcasts. None about this event: https://talks.2019.foss4g.org/bucharest/talk/NGUFND/
ISRIC:152160 - The Homolosine Projection in a Big Spatial Data framework (foss4g2019)
Marinus of Tyre's and Mercator's are by far the most popular projections used today in the Earth Sciences. However, they expand the surface area of the Earth respectively by 50% and 200%, imposing serious overheads in data storage, and more importantly, computation costs. While an equal-area projection is the evident solution, those supported by FOSS4G are scant; a choice is not straightforward. ISRIC, the World Data Centre for Soils, creates and serves global high resolution maps of continuous estimates of soil properties and soil classes. ISRIC had until recently created its products in the millinery projection of Marinus of Tyre, but in face of ramping computation costs, it initiated a process to adopt an equal-area projection. After carefully benchmarking various candidates, the option rested on the Homolosine, a modern projection developed by J.P. Goode that is supported both by PROJ and GDAL. This address details the advantages of the Homolosine projection over other FOSS4G supported equal-area projections. It also highlights the limitations of FOSS4G in working with the Homolosine and the strategies to overcome them. 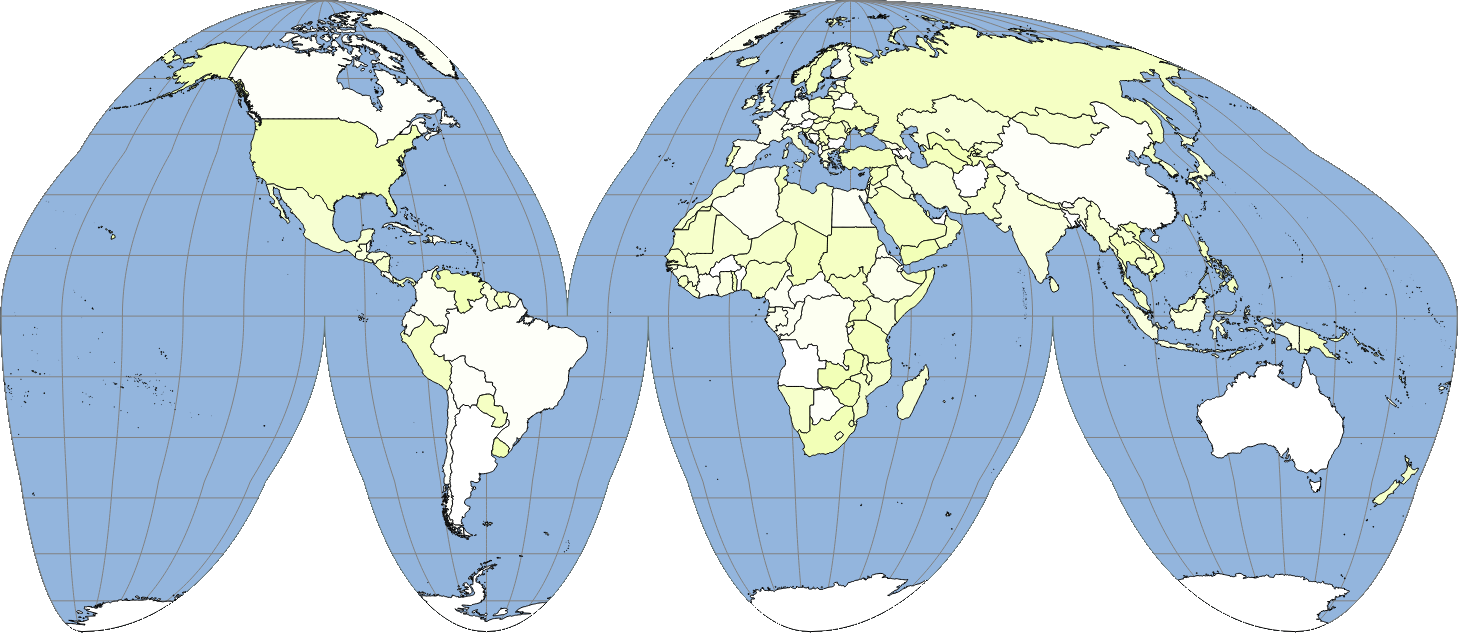 None about this event: https://talks.2019.foss4g.org/bucharest/talk/QXFDXE/
Open data in health-geomatics: mapping and evaluating publicly accessible defibrillators (foss4g2019)
Geomatics is the key resource in analyzing the deployment of publicly accessible Automated External Defibrillators (AED). Since AEDs are only effective if used within 6 minutes from the onset of an Out-of-Hospital Cardiac Arrest (OHCA), they have a limited area of effectiveness (i.e. ‘catchment area’, CA), that is traditionally computed as a circular surface with radius = 100m. The availability of open geospatial data related to roads network and edification on the territory allows to compute realistic catchment areas based on the effective distance along streets, which is a novel approach, never compared with the traditional method. Aim of this study was to compare the two approaches, and to evaluate if the territory analysis could support decision making about the mapping technique better suiting each device. The study was performed and validated on the territory of Lombardy (Italy, total surface 23’863.65 km2), and CAs were computed for 7458 known AEDs on the territory (at 28/02/2018). The analysis was performed exploiting open source software, specifically QGIS and PostGIS with pgRouting extension. Setting a limit of 200m for the realistic CAs, their mean surface for the considered dataset resulted close to that of the traditional circular area: 33’665 m2 against 31’416 m2. However, the spatial coverage of OHCAs (events occurring inside a CA, on the base of a georeferenced database of 45039 OHCAs occurred in Lombardy within 1/1/2015 and 31/12/2018) estimated considering circular areas (9.43%) is very different from that obtained considering realistic areas (15.35%). The distribution of the mapping error (surface of realistic CA – surface of circular CA) was studied, and its correlation with the characteristics of the surrounding territory was inspected. The considered attributes were: I) distance from the device to the nearest road; II) total length of the roads in the surrounding area; III) number of roads network nodes in the surrounding area; IV) percentage of edified surface in the surrounding area; surrounding area for II) to IV) was a circular area of 50, 100, 150, 200 and 250 m radius. The most correlated attributes were: I) R = -0.58 (p<0.05), and II) R = 0.65 (p<0.05) in 50m-radius area. Results suggest that circular CAs underestimate the spatial coverage of AEDs located nearby streets in a densely networked area, and in these cases realistic CAs, better suiting real-world scenario, are preferable. However, when AEDs are far from the streets, realistic mapping is not reliable, and the use of circular areas is preferable. This second situation is typical of large and isolated facilities (e.g. airports, sport facilities, warehouses), and the circular area better estimates the coverage of the facility itself. With known AEDs location, open data and open source software are reliable enough to decide which mapping technique will result in a better estimation of the CA. None about this event: https://talks.2019.foss4g.org/bucharest/talk/KQNMDG/
Geospatial data processing for image automatic analysis (foss4g2019)
Deep learning algorithms appear as a major breakthrough in GIS scope: neural networks are able to do semantic segmentation on aerial images, so as to identify building footprints, roads, and so on. Oslandia is an opensource company studying and exploiting geospatial data, with an extensive R&D activity about geospatial data science. This presentation will detail some of our Python routines in terms of geospatial data handling. We will describe our processes from raw data to prediction results. As the main step of the pipeline, machine learning techniques (e.g. convolutional neural networks for image semantic segmentation with Keras) produce valuable predictions. In the case of geospatial data, a postprocessing step is often necessary for displaying the results in web applications and GIS tools. A concrete illustration of our results will be provided through a light Flask application designed for demonstration purpose. None about this event: https://talks.2019.foss4g.org/bucharest/talk/WRHNWY/
Mapping the Fate of the Dead in North Korea with Free & Open Source Software and Data (foss4g2019)
For the last four years, the Transitional Justice Working Group's mapping project has interviewed North Korean escapees living in South Korea in an effort to determine where the victims of the regime have been killed and buried. This talk will present the mapping system we've developed, the challenges we've faced building it, and how many of these challenges have been partially or fully addressed using free and open source software and data (FOSSD). Our first two mapping reports and a few data sets of sites suspected of containing documents can be found at https://en.tjwg.org/mapping-project-north-korea/. None about this event: https://talks.2019.foss4g.org/bucharest/talk/K7ZTHW/
Building a geo marketing tool with open source geospatial software (foss4g2019)
# Building a geo marketing tool with open source geospatial software We want to tell about the journey we undertook to build a geo marketing platform using open source geospatial software. The platform is also powered using open data. We used Postgis, Open Layers, QGis, Geo Server and many more. We want to show how business value can be generated using open source software. None about this event: https://talks.2019.foss4g.org/bucharest/talk/Z8X8S7/
Serverless infrastructure to manage vector and tiff data: pbf and COGs (foss4g2019)
Classical spatial information architectures have required a server for the dissemination of spatial information at vector and raster level. With the evolution of technologies and the empowerment of navigators, new alternatives to the dissemination of spatial information in vector and raster format have appeared. Thus, at present, it is possible to conform an architecture serverless that allows the publication of spatial information based on the following standards and technologies: * Vectorial information in .pbf format using the STAC and WFS3 architecture. * Serverless raster information using COGs: Cloud Optimised Geotiffs * Rendering of large amounts of information via WebGL in the browser. This talk offers an overview of a full serverless architecture based on OpenSource technologies. None about this event: https://talks.2019.foss4g.org/bucharest/talk/3QJRX7/
Space-enabled opportunities in business incubation, applications and services (foss4g2019)
This is the ESA slot. abstract text abstract text abstract text abstract text abstract text abstract text abstract text abstract text abstract text abstract text abstract text abstract text abstract text abstract text abstract text abstract text abstract text abstract text abstract text abstract text abstract text abstract text abstract text abstract text None about this event: https://talks.2019.foss4g.org/bucharest/talk/BLQU7Q/