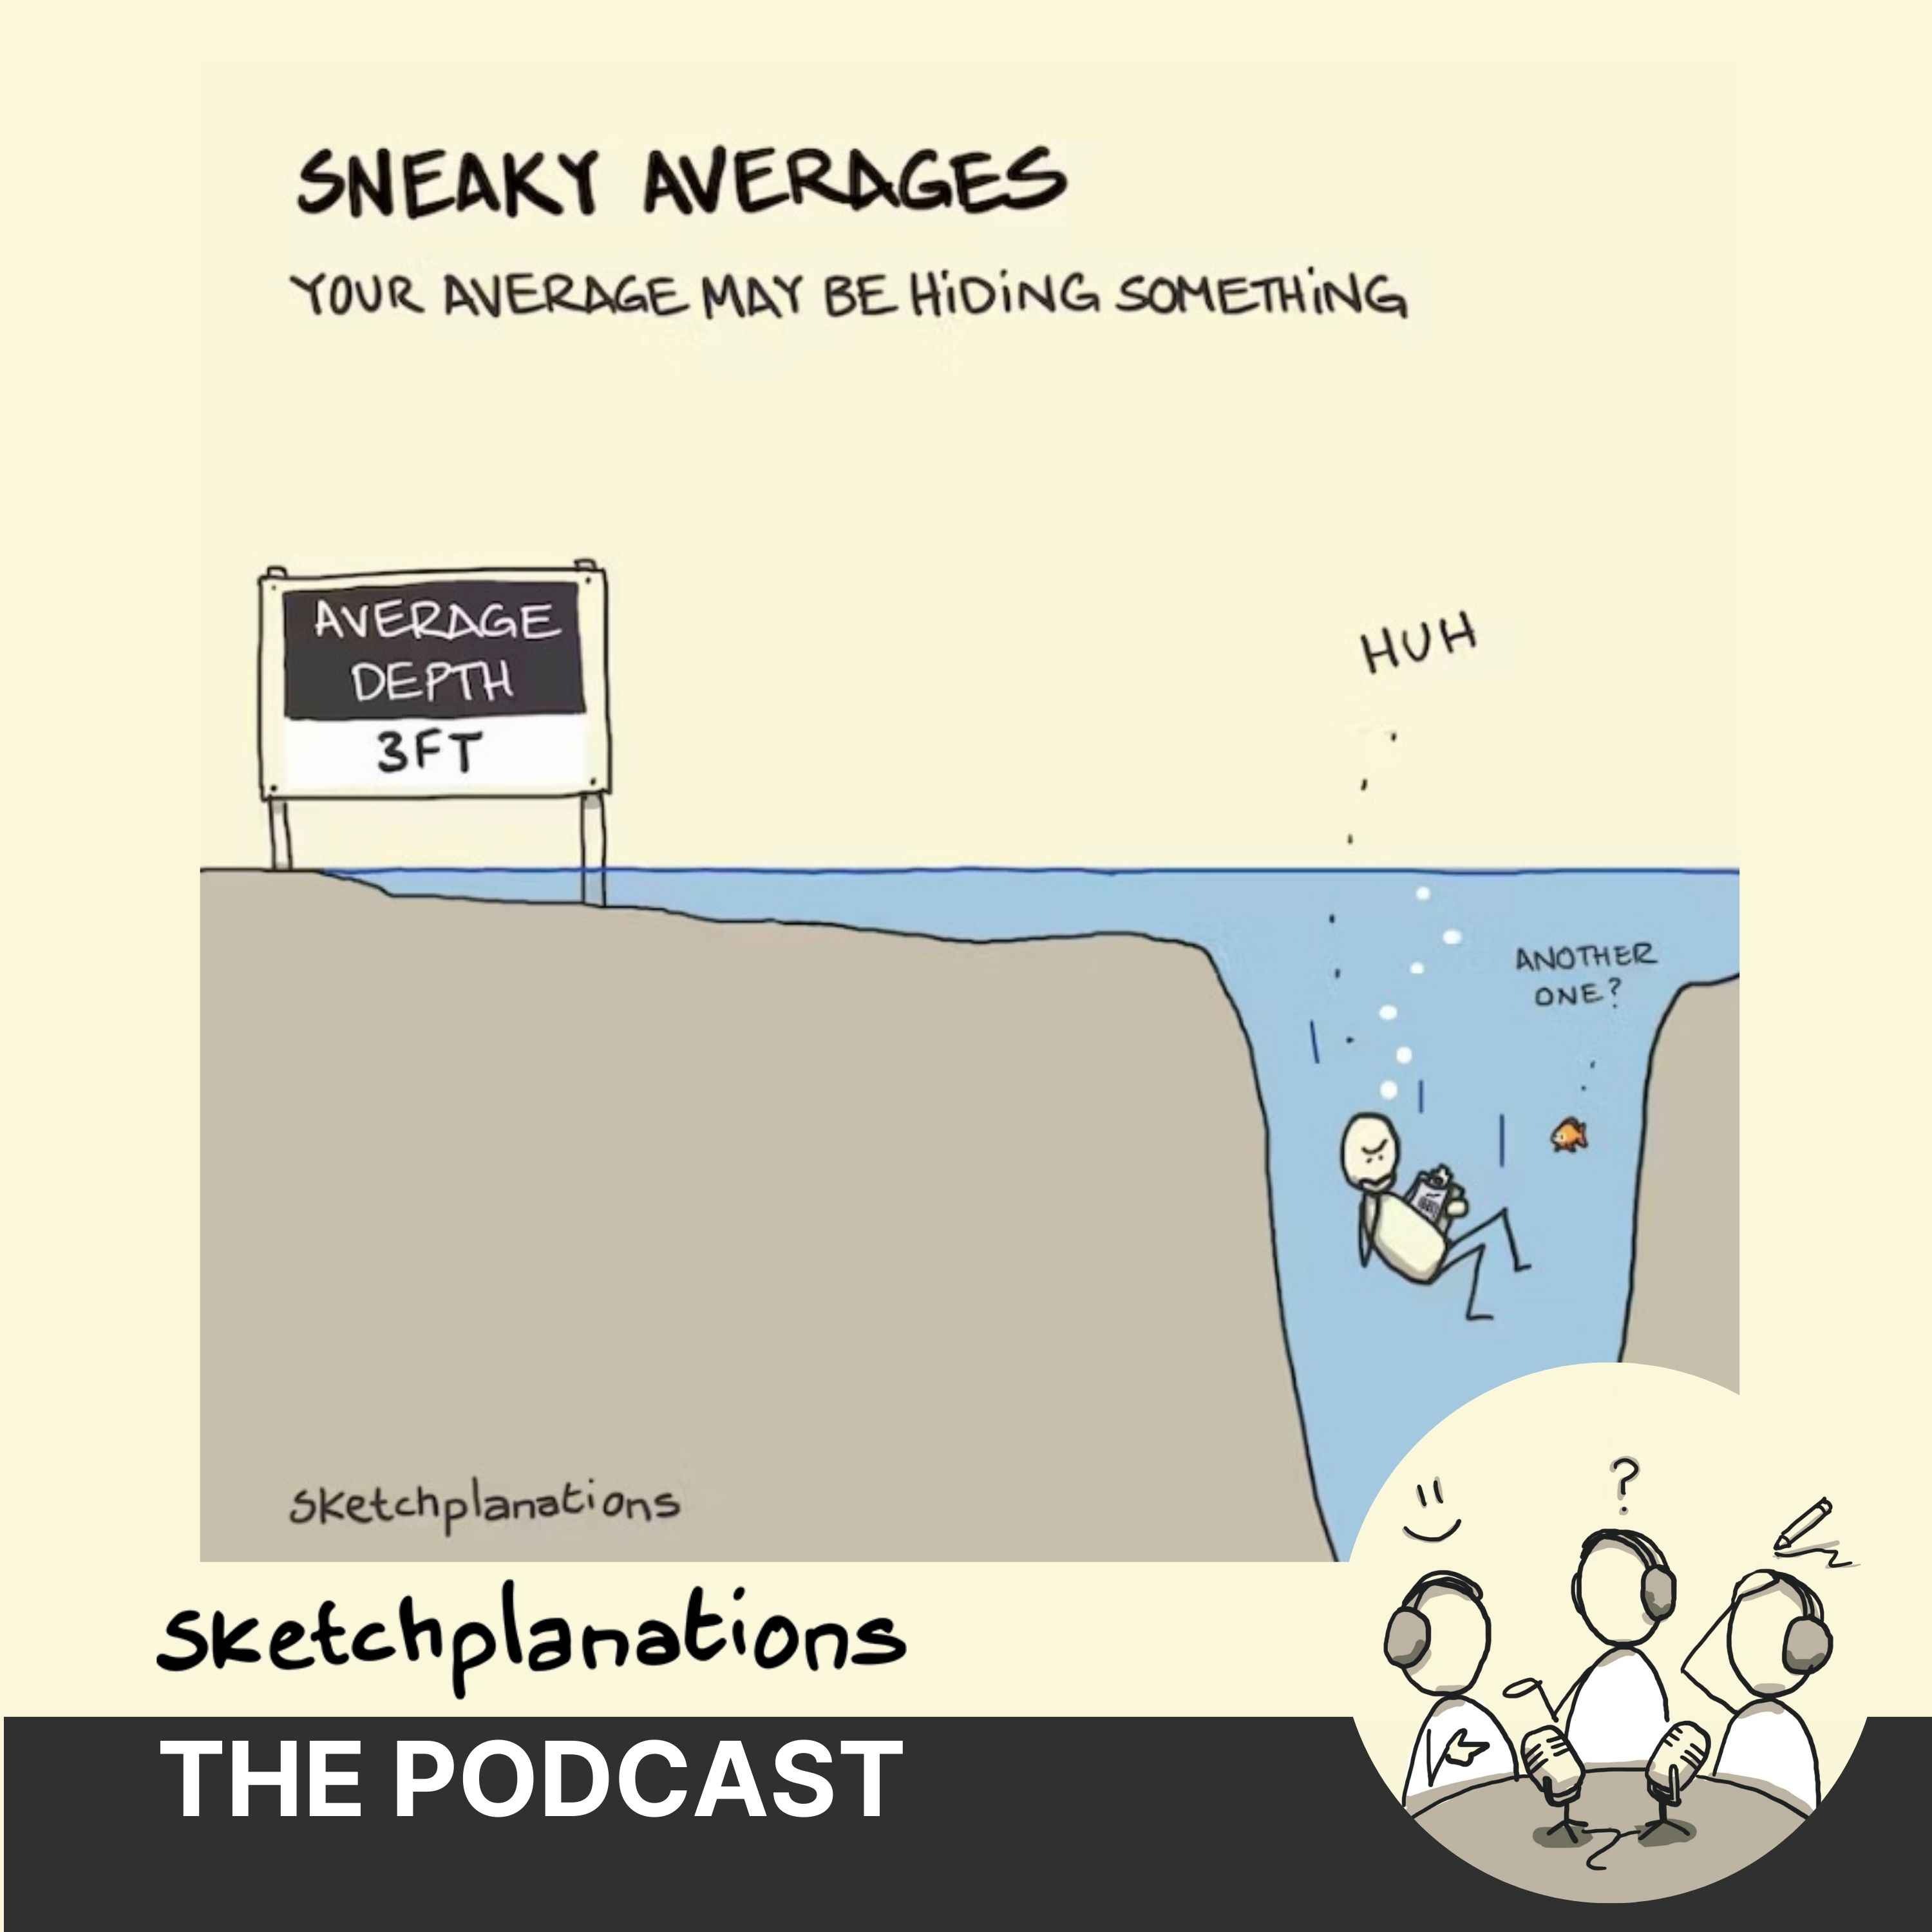
Sneaky Averages
When the average may be hiding something
Sketchplanations - The Podcast · Robert Bell
Audio is streamed directly from the publisher (sphinx.acast.com) as published in their RSS feed. Play Podcasts does not host this file. Rights-holders can request removal through the copyright & takedown page.
Show Notes
Do you work with data and statistics?
Actually, it doesn't matter if you do or not, you're bound to have come across averages of some kind at some point.
And, as we discuss in this episode, the average can often hide key information about a data set.
We'd love to know your thoughts or experiences with Sneaky Averages.
email us: [email protected]
There's an old story about the statistician who drowned after seeing that the average depth was 3ft. Averages, or in this case the mean, necessarily hide some data, but very often they also hide what's really going on.
As Jono's psychology professor at UC Berkeley, Sheldon Zedeck, taught him; spend time with your data.
You can find the headline sketch here.
Other sketches referenced in this episode include:
Additionally, we mention the very entertaining website spurious correlations - where you'll find a whole load of amusing graphs.
We mentioned Edward Tufty's work: The Visual Display of Quantitative Information
There's the ever-fascinating musings of Tim Harford in his podcast (More or Less) and his book (The Undercover Economist)
And there's our mate Jez Clements who holds the Guiness World marathon record for the fastest male dressed as a 3D TV Character.
Finally, I'm not the only one who struggles saying the word "statistics" repeatedly!!
Find many more sketches at Sketchplanations.com
All Music on this podcast series is provided by Franc Cinelli. Find many more tracks at franccinelli.com
Hosted on Acast. See acast.com/privacy for more information.