Audio is streamed directly from the publisher (anchor.fm) as published in their RSS feed. Play Podcasts does not host this file. Rights-holders can request removal through the copyright & takedown page.
Show Notes
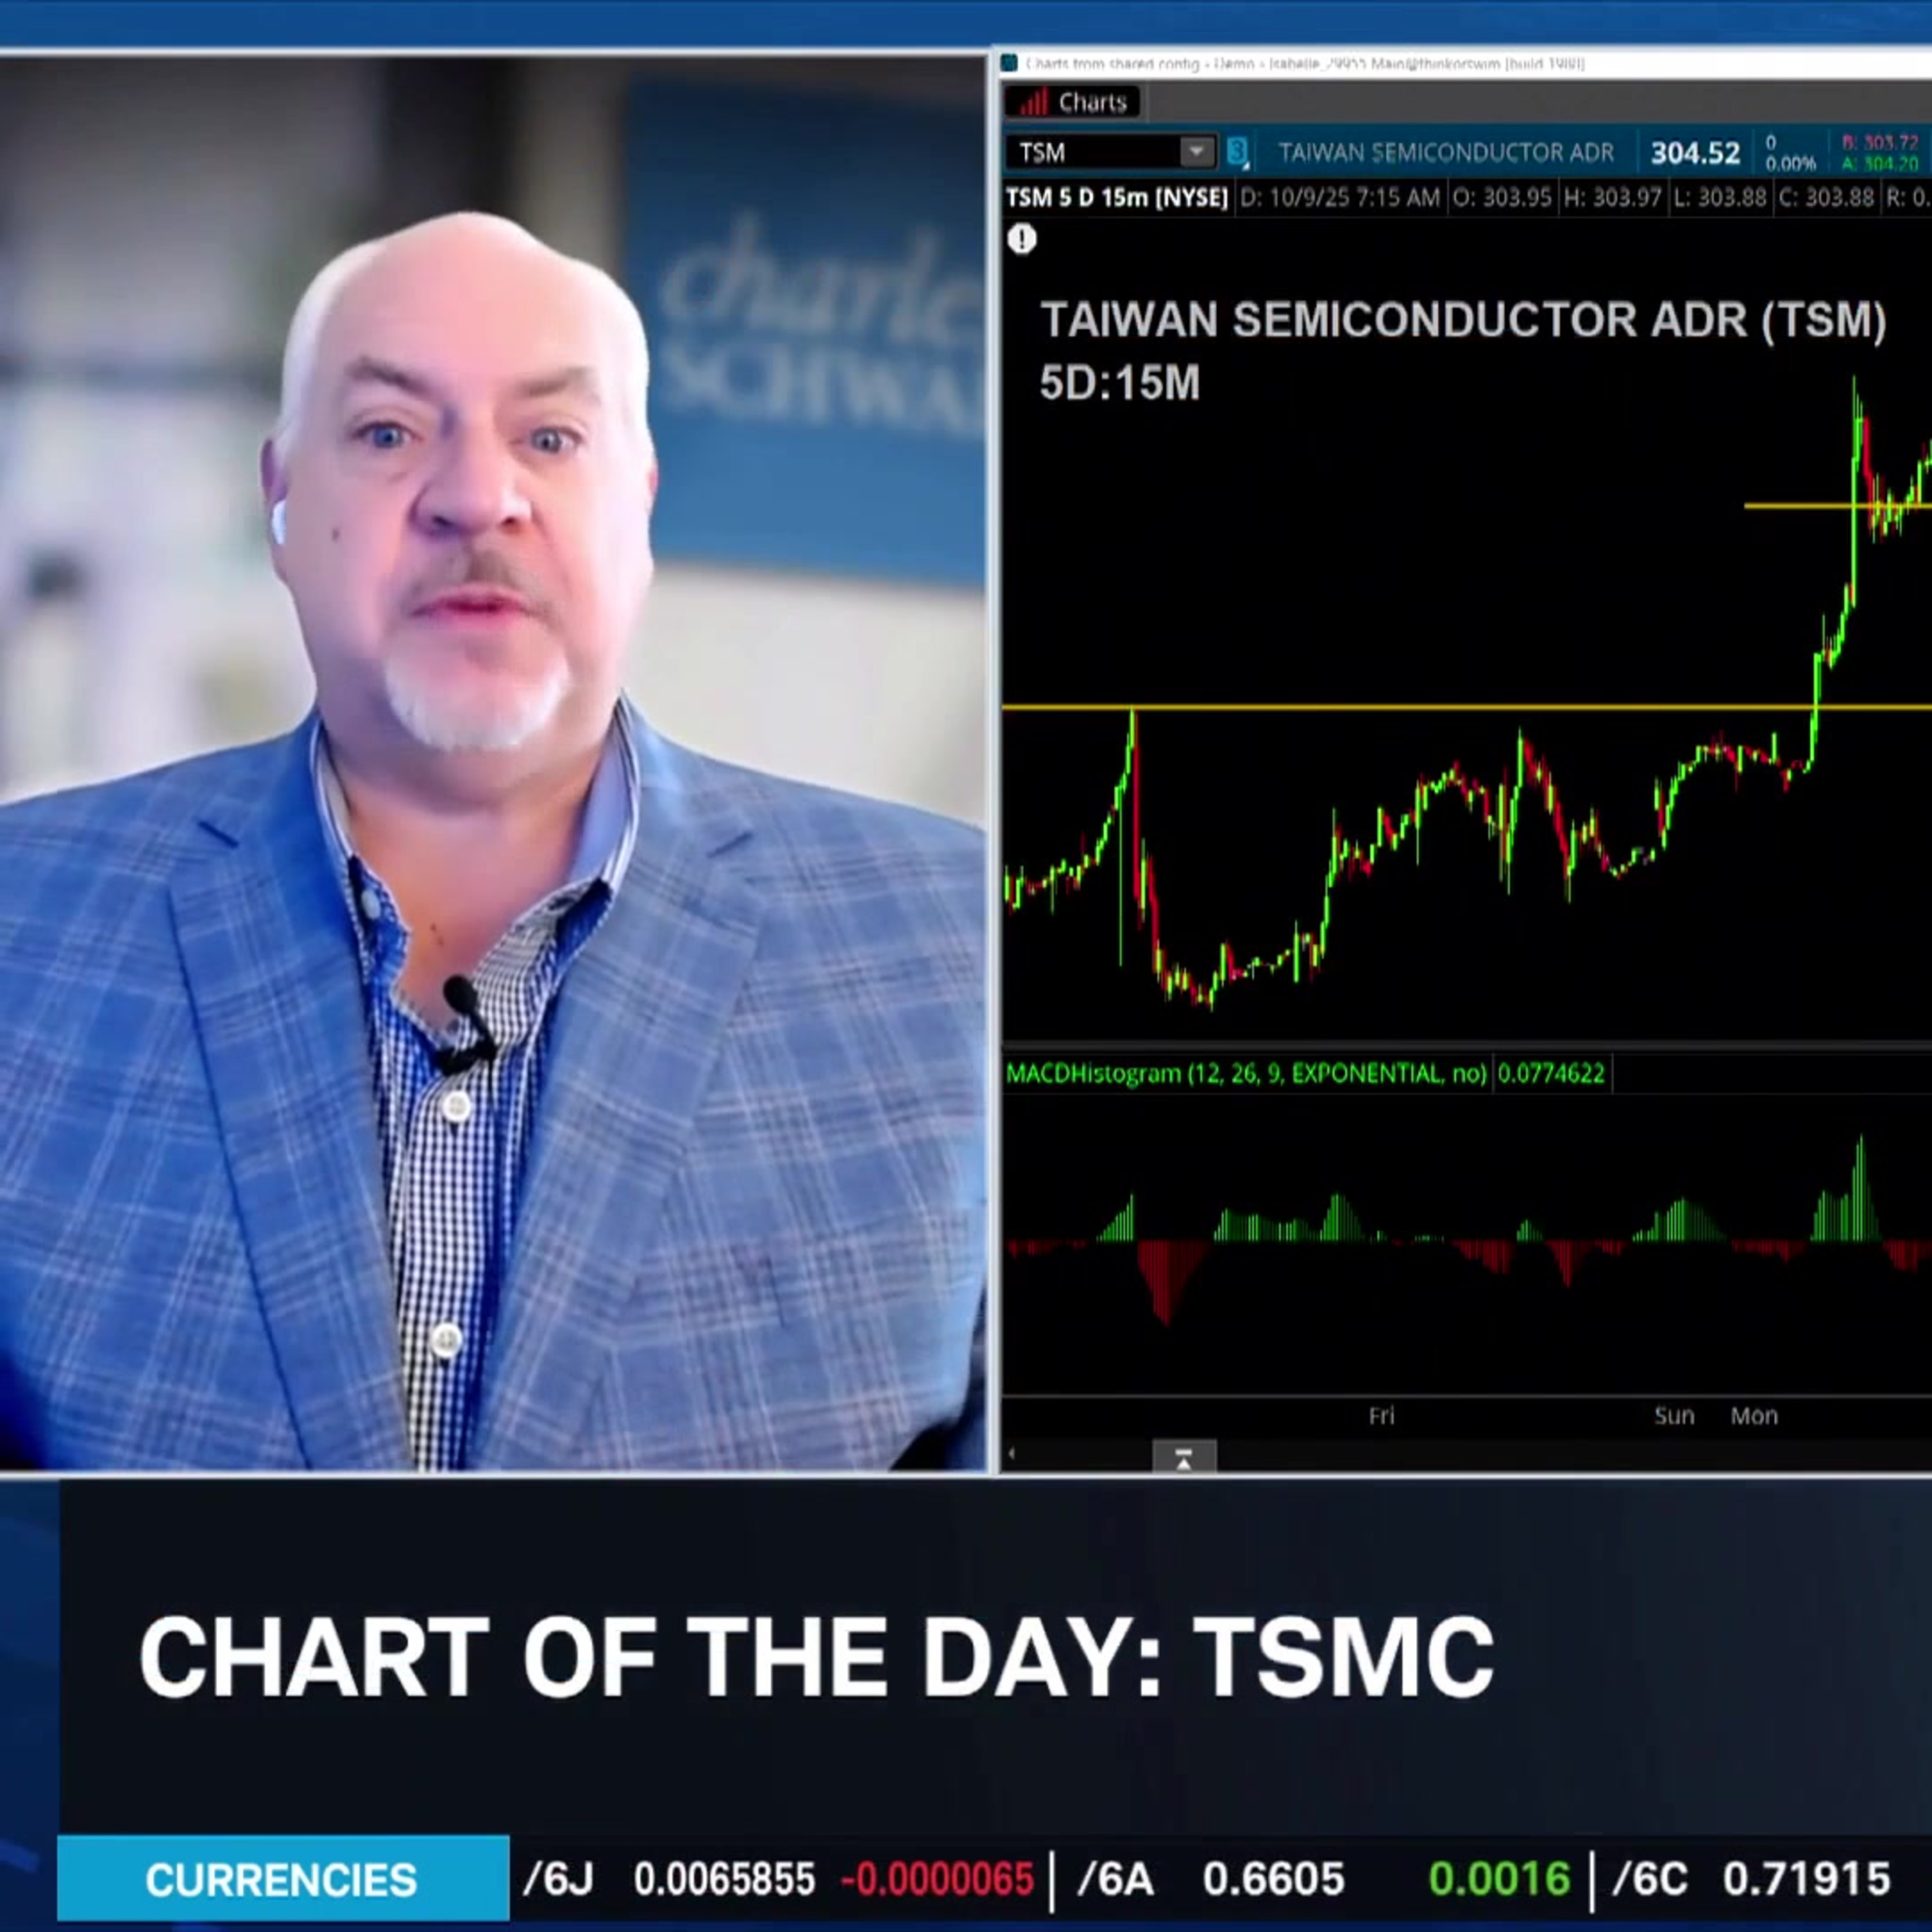
Ben Watson dials up the short-term chart for TSMC (TSM) and shows technical patterns that could indicate "frothiness" with big up and down swings. On the 5-day timeframe, he points to $307 as a possible resistance point and $296 as a level of support. He does say its hard to deny the upward trend on this chart, pointing to the symmetrical jumps since the company's July earnings event. This week he says there's a "bullish earmuffs" pattern developing for TSM shares.
======== Schwab Network ========
Empowering every investor and trader, every market day.
Subscribe to the Market Minute newsletter - https://schwabnetwork.com/subscribe
Download the iOS app - https://apps.apple.com/us/app/schwab-network/id1460719185
Download the Amazon Fire Tv App - https://www.amazon.com/TD-Ameritrade-Network/dp/B07KRD76C7
Watch on Sling - https://watch.sling.com/1/asset/191928615bd8d47686f94682aefaa007/watch
Watch on Vizio - https://www.vizio.com/en/watchfreeplus-explore
Watch on DistroTV - https://www.distro.tv/live/schwab-network/
Follow us on X – / schwabnetwork
Follow us on Facebook – / schwabnetwork
Follow us on LinkedIn - / schwab-network
About Schwab Network - https://schwabnetwork.com/about