Audio is streamed directly from the publisher (anchor.fm) as published in their RSS feed. Play Podcasts does not host this file. Rights-holders can request removal through the copyright & takedown page.
Show Notes
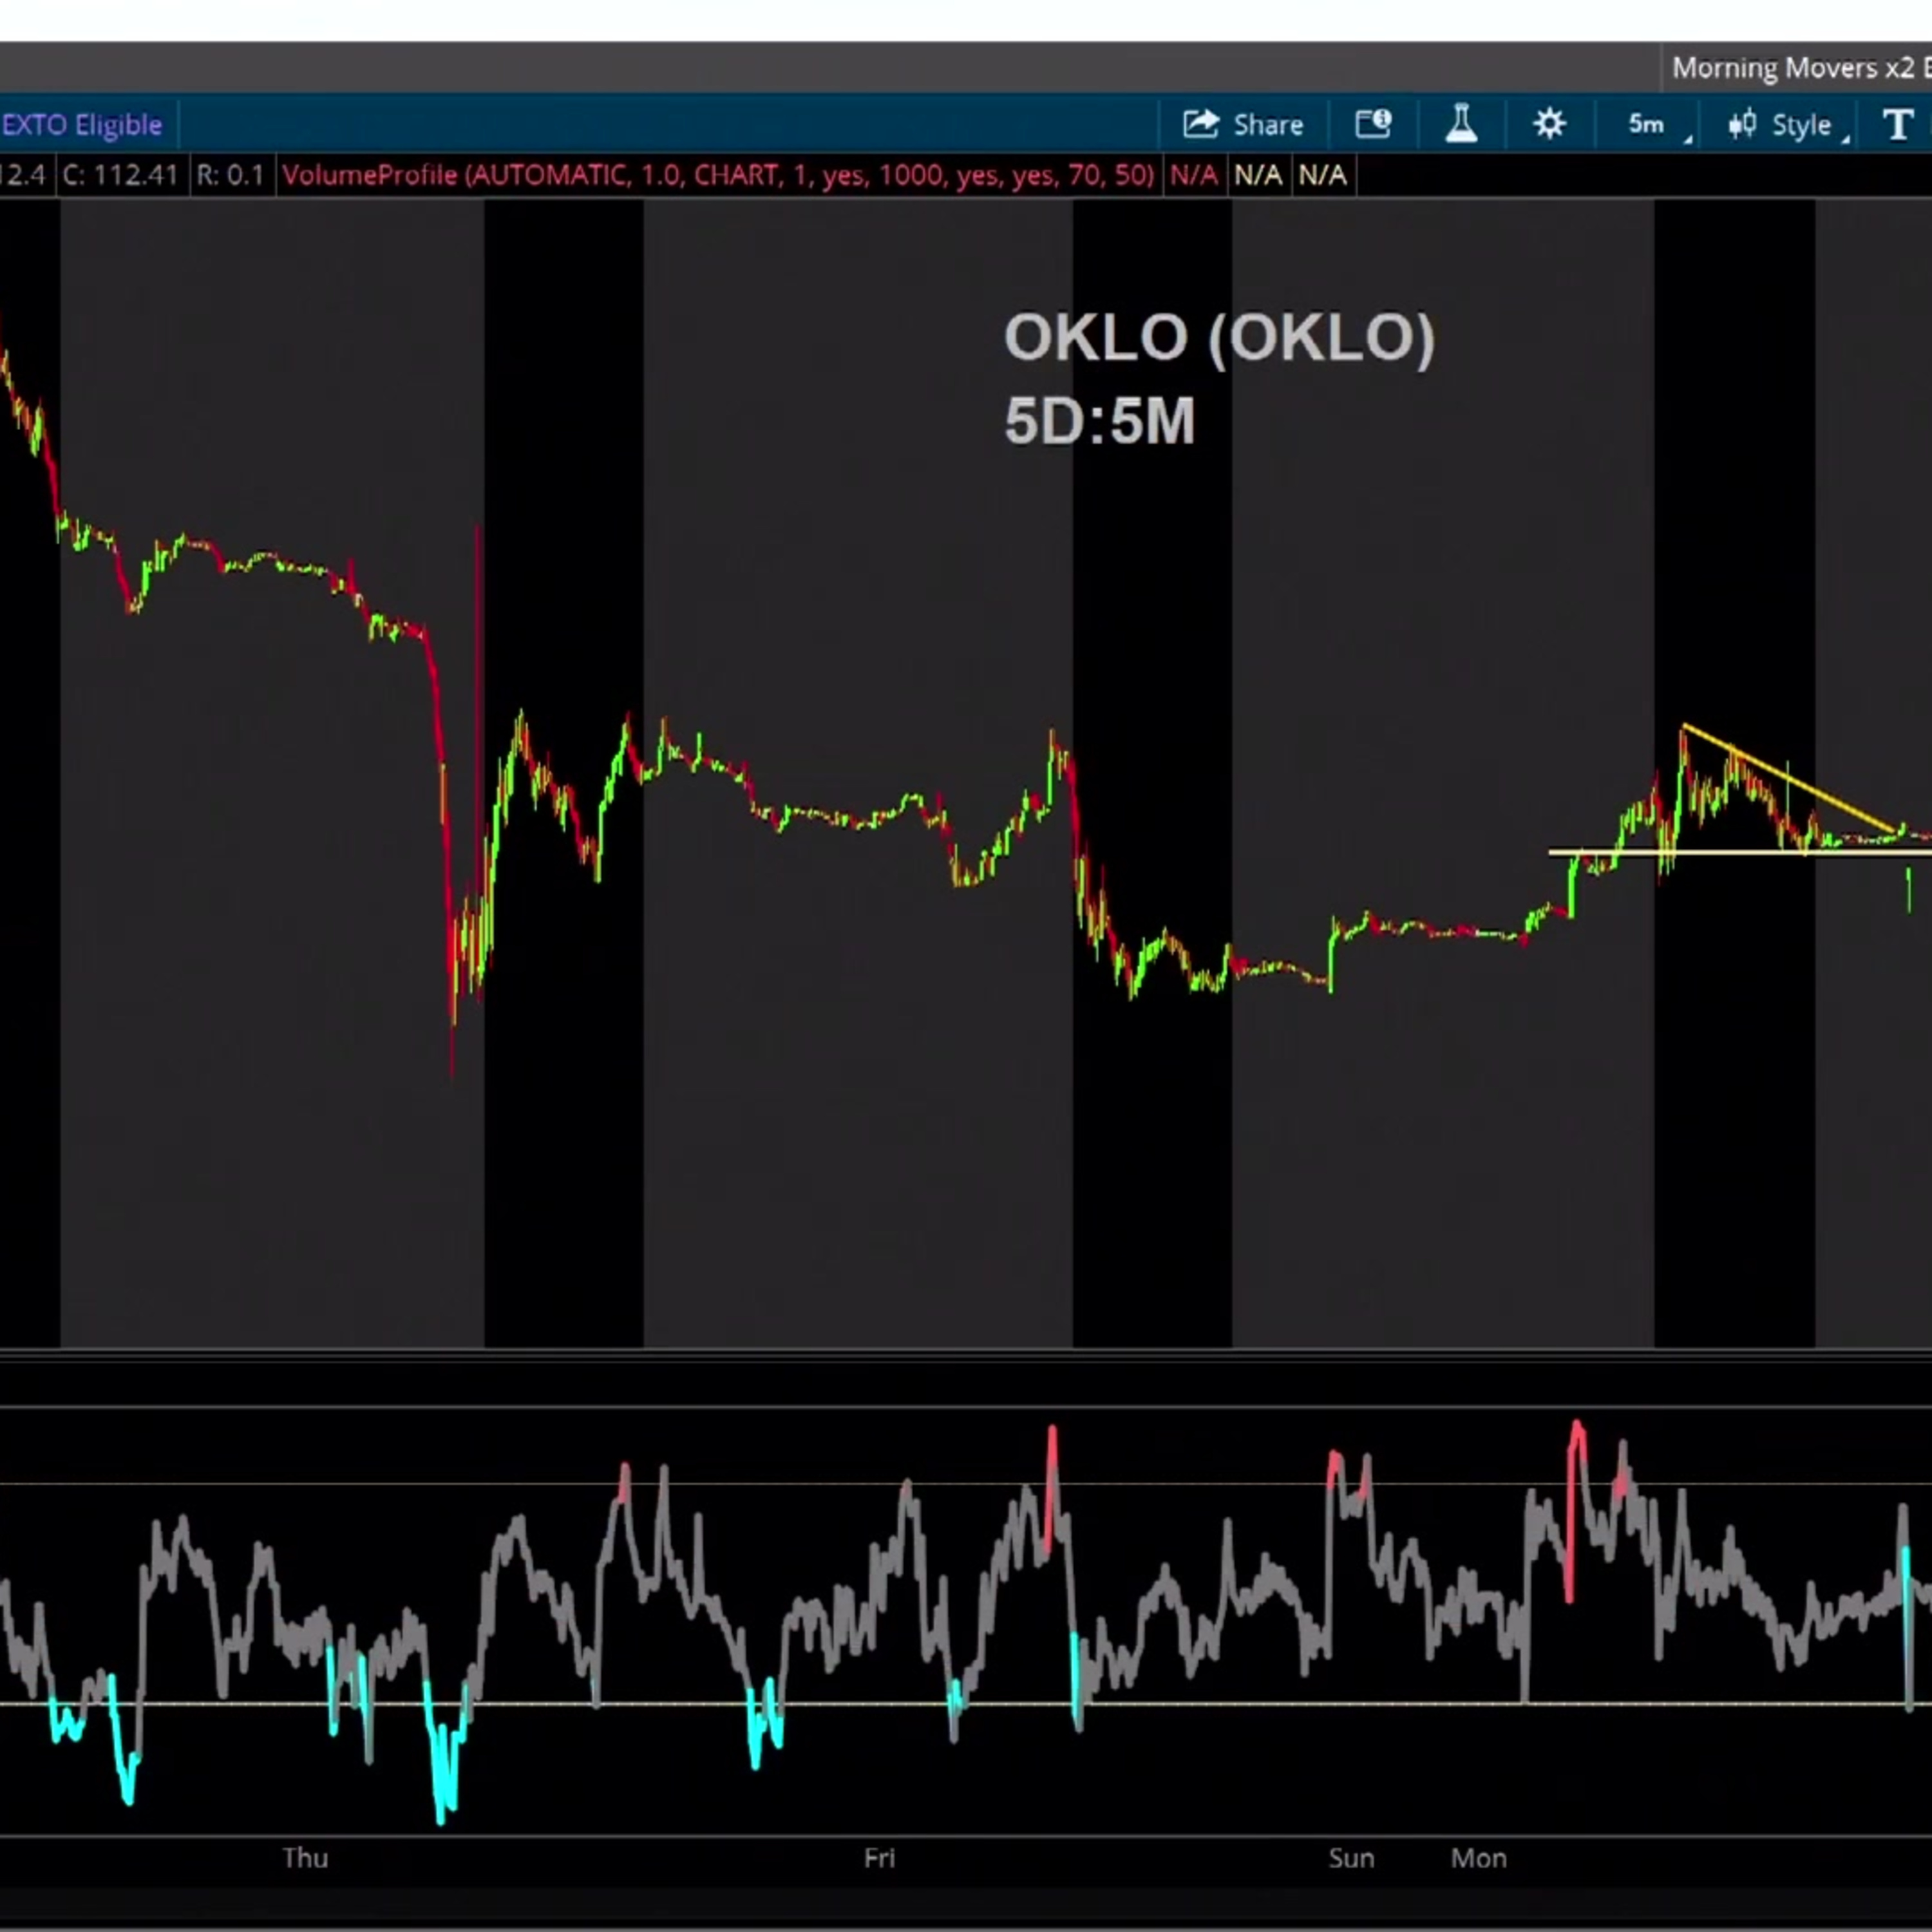
Brett Crowther powers up the chart for Oklo (OKLO) to break down the technical trends taking place in the nuclear energy stock. On the 5-day chart, he says the stock is flattening out a bit, but on the 3-month timeframe he shows how significant its rally has been. Brett points to the $106 level as an area of support after falling from $144 highs. He highlights the 50% retracement and 50% projections using a Fibonacci study that indicates potential areas the stock could test on further downside or upside moves.
======== Schwab Network ========
Empowering every investor and trader, every market day.
Subscribe to the Market Minute newsletter - https://schwabnetwork.com/subscribe
Download the iOS app - https://apps.apple.com/us/app/schwab-network/id1460719185
Download the Amazon Fire Tv App - https://www.amazon.com/TD-Ameritrade-Network/dp/B07KRD76C7
Watch on Sling - https://watch.sling.com/1/asset/191928615bd8d47686f94682aefaa007/watch
Watch on Vizio - https://www.vizio.com/en/watchfreeplus-explore
Watch on DistroTV - https://www.distro.tv/live/schwab-network/
Follow us on X – / schwabnetwork
Follow us on Facebook – / schwabnetwork
Follow us on LinkedIn - / schwab-network
About Schwab Network - https://schwabnetwork.com/about