Audio is streamed directly from the publisher (anchor.fm) as published in their RSS feed. Play Podcasts does not host this file. Rights-holders can request removal through the copyright & takedown page.
Show Notes
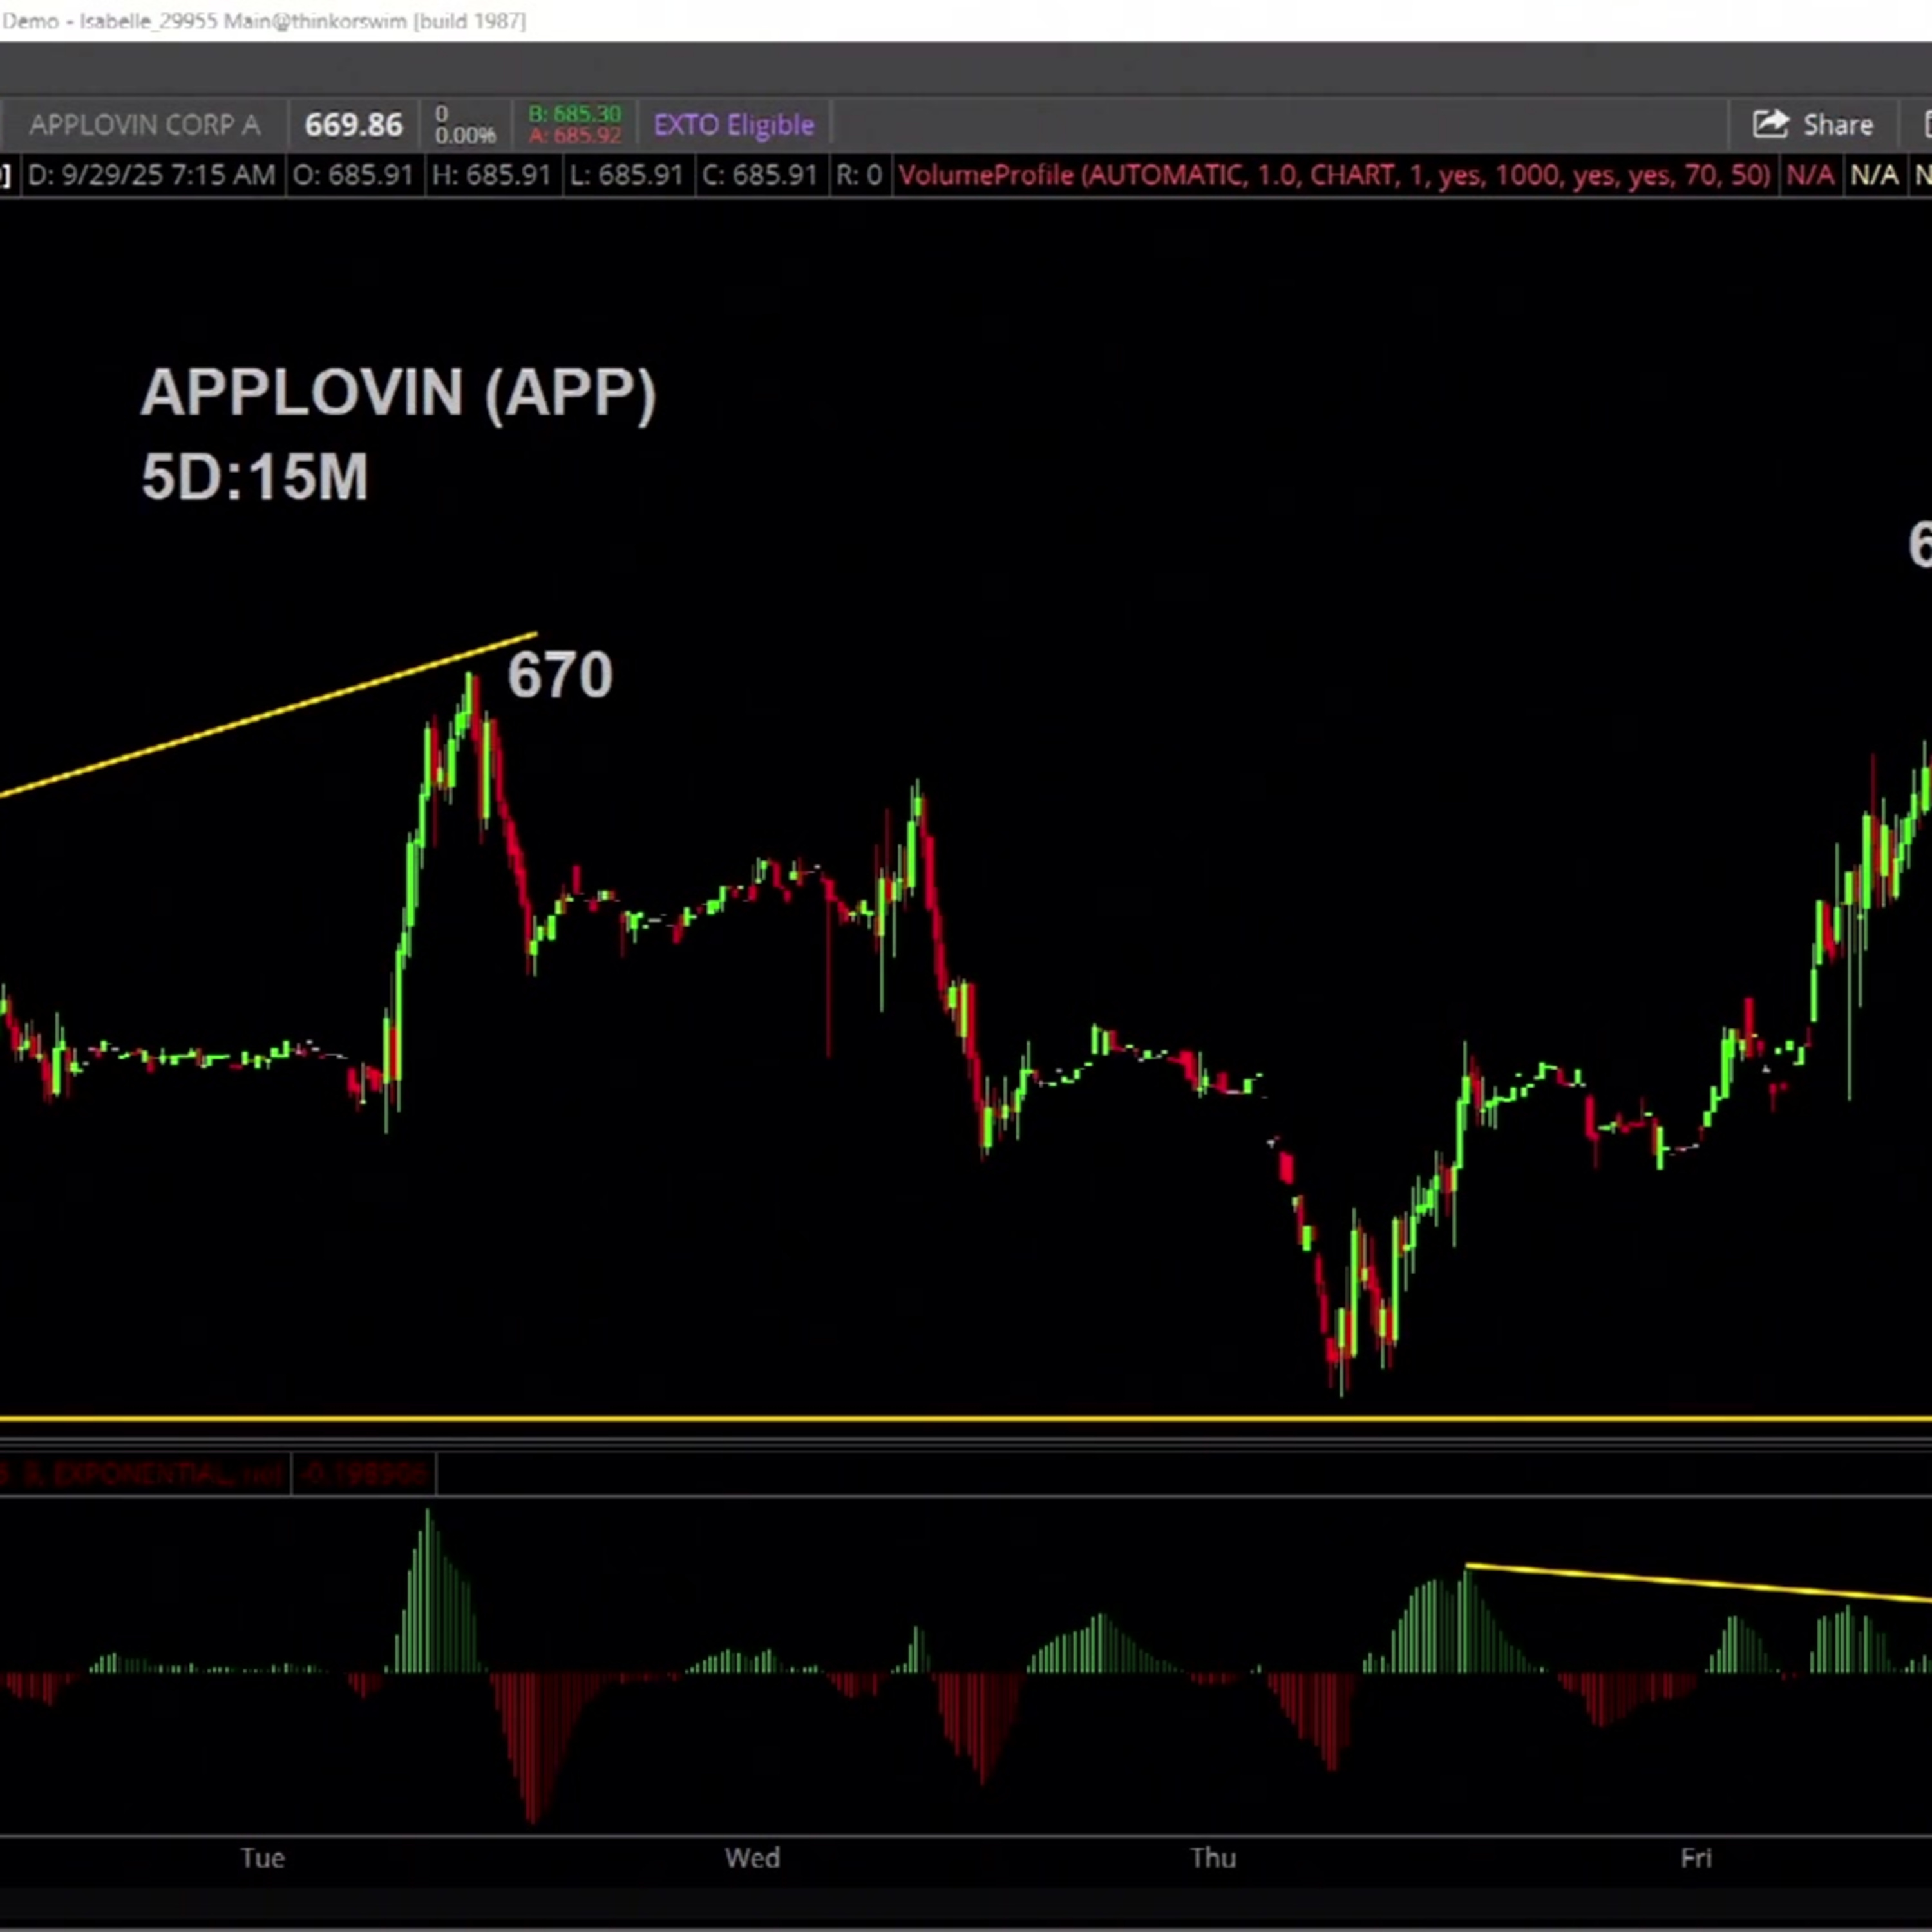
Ben Watson examines the AppLovin (APP) chart over the past 5 days which fell as low as $620 and rallied as high as $690. On the 1-year chart, he says the $530 resistance area has been broken through and he draws a potential upside level around $755. With shares up more than 420% from its 52-week lows and likely opening at new all-time highs, Ben points to the rising RSI momentum study going back as far as June as a bullish indicator to watch.
======== Schwab Network ========
Empowering every investor and trader, every market day.
Subscribe to the Market Minute newsletter - https://schwabnetwork.com/subscribe
Download the iOS app - https://apps.apple.com/us/app/schwab-network/id1460719185
Download the Amazon Fire Tv App - https://www.amazon.com/TD-Ameritrade-Network/dp/B07KRD76C7
Watch on Sling - https://watch.sling.com/1/asset/191928615bd8d47686f94682aefaa007/watch
Watch on Vizio - https://www.vizio.com/en/watchfreeplus-explore
Watch on DistroTV - https://www.distro.tv/live/schwab-network/
Follow us on X – https://twitter.com/schwabnetwork
Follow us on Facebook – https://www.facebook.com/schwabnetwork
Follow us on LinkedIn - https://www.linkedin.com/company/schwab-network/
About Schwab Network - https://schwabnetwork.com/about