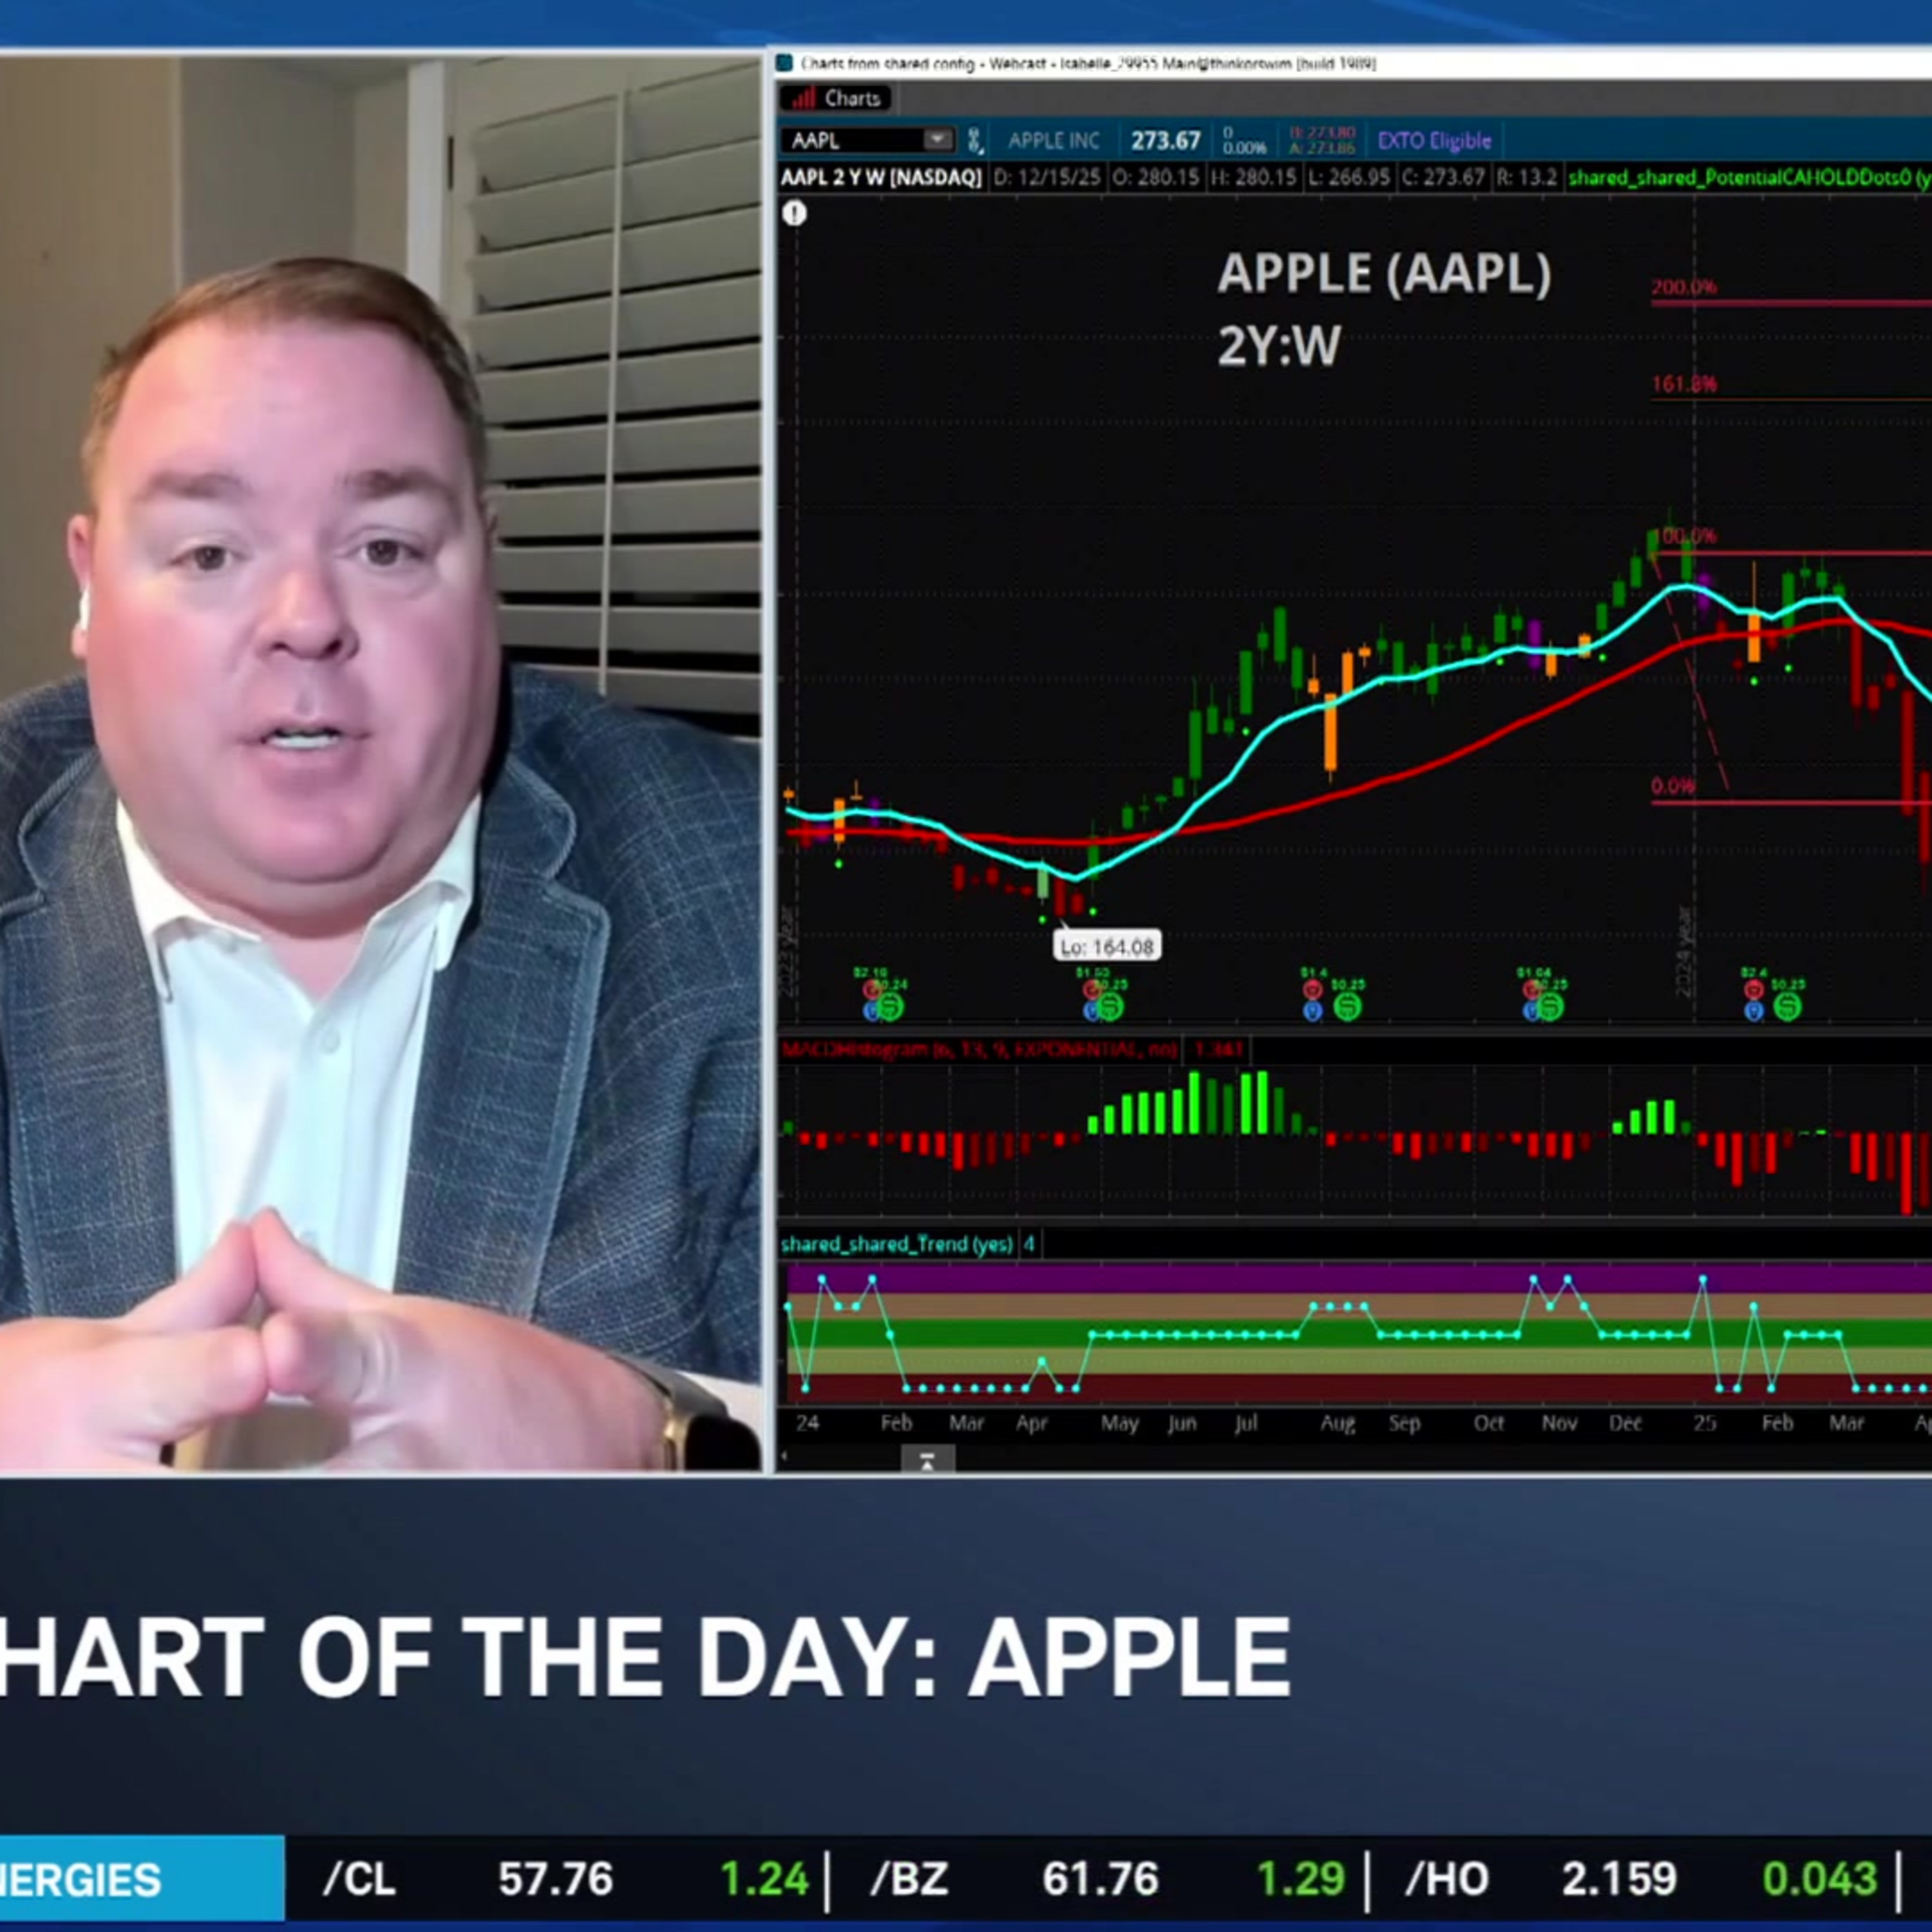
AAPL Charts: Analyzing a 5% Pullback and Key Support Levels
Schwab Network · Schwab Network
Audio is streamed directly from the publisher (anchor.fm) as published in their RSS feed. Play Podcasts does not host this file. Rights-holders can request removal through the copyright & takedown page.
Show Notes
James Boyd analyzes Apple (AAPL) charts, noting a 5% pullback from its high. He dissects moving averages, candle colors, and horizontal support levels. James also examines a two-year chart, emphasizing the significance of the 250 threshold and the 161% extension. He says that it’s normal to take profits after reaching goals. He suggests that if the stock stays at its current level, it could reach its highest point and make more money.
======== Schwab Network ========
Empowering every investor and trader, every market day.
Subscribe to the Market Minute newsletter - https://schwabnetwork.com/subscribe
Download the iOS app - https://apps.apple.com/us/app/schwab-network/id1460719185
Download the Amazon Fire Tv App - https://www.amazon.com/TD-Ameritrade-Network/dp/B07KRD76C7
Watch on Sling - https://watch.sling.com/1/asset/191928615bd8d47686f94682aefaa007/watch
Watch on Vizio - https://www.vizio.com/en/watchfreeplus-explore
Watch on DistroTV - https://www.distro.tv/live/schwab-network/
Follow us on X – https://twitter.com/schwabnetwork
Follow us on Facebook – https://www.facebook.com/schwabnetwork
Follow us on LinkedIn - https://www.linkedin.com/company/schwab-network/
About Schwab Network - https://schwabnetwork.com/about