This Is The Most Terrifying Graph In The World
Public · Michael Shellenberger and Leighton Woodhouse
January 14, 20240m 16s
Audio is streamed directly from the publisher (api.substack.com) as published in their RSS feed. Play Podcasts does not host this file. Rights-holders can request removal through the copyright & takedown page.
Show Notes
This is a free preview of a paid episode. To hear more, visit www.public.news
There are a lot of scary charts and graphs out there.
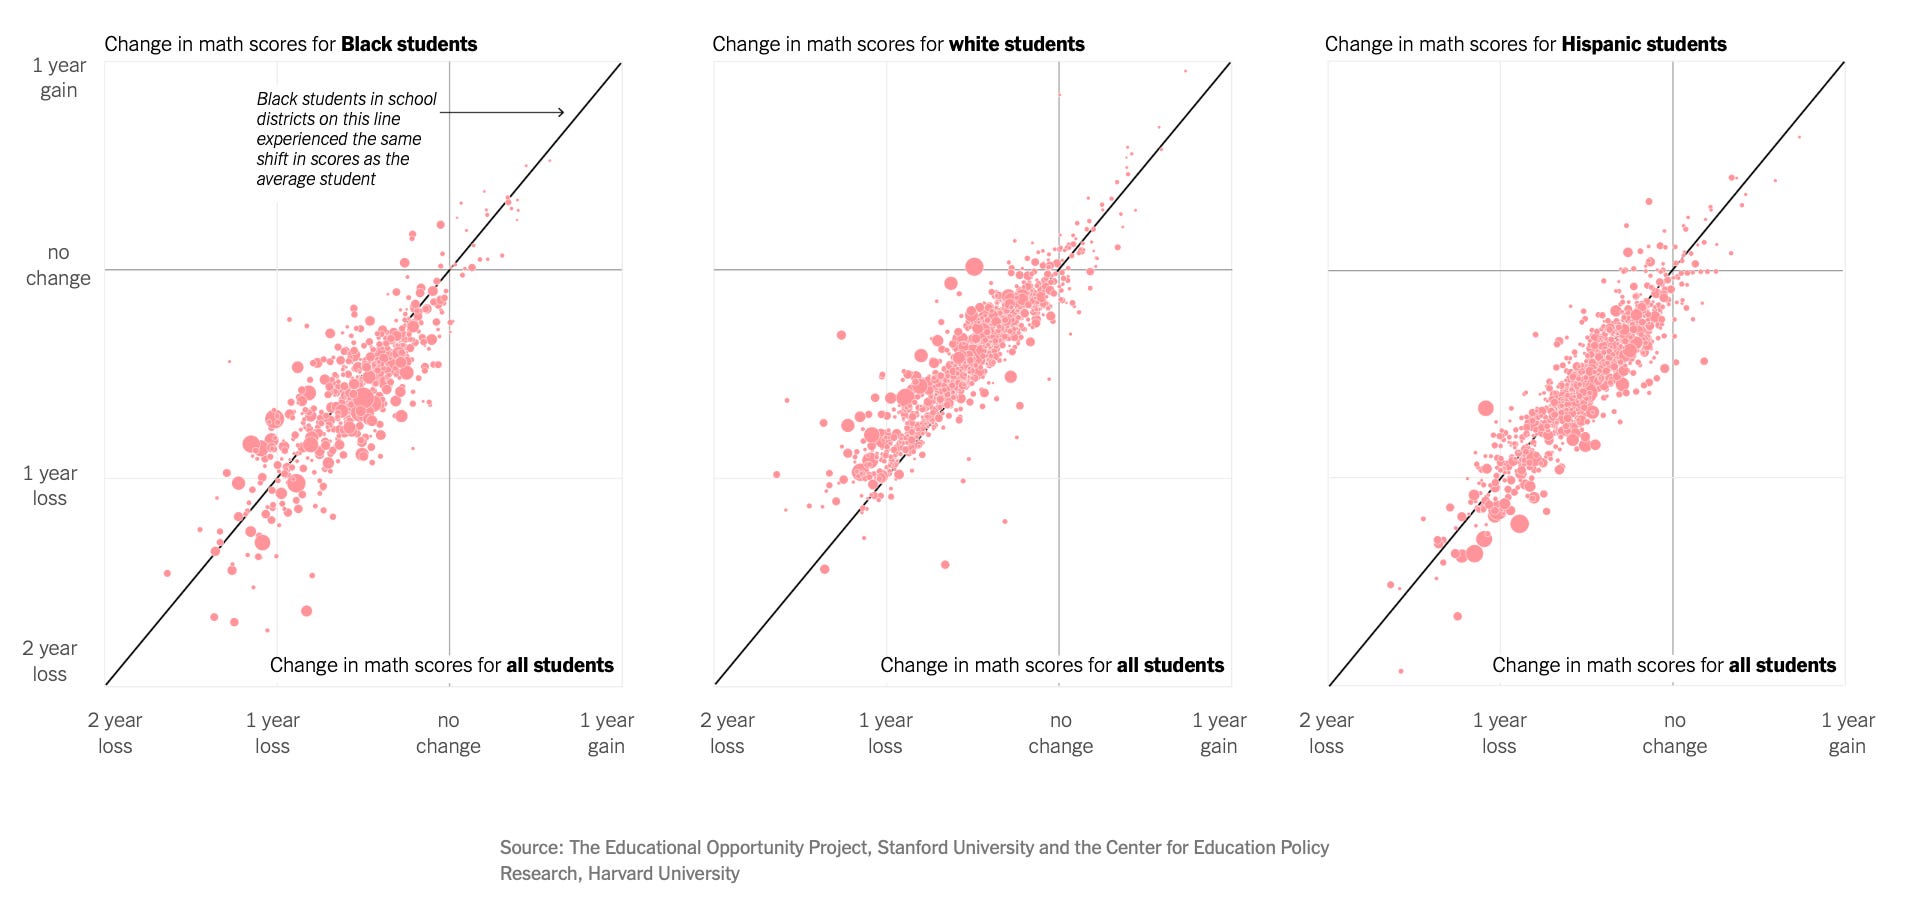
Like this one, which shows learning loss during covid lockdowns.
Or this one, which shows the increase in illicit drug deaths over the last twenty years.
Or this one, which shows the spike in illegal border crossings.
But this chart is scarier than the others: