Your First Interactive Plot in Python: A Hands-On Plotly Guide
Programming Tech Brief By HackerNoon
Audio is streamed directly from the publisher (media.transistor.fm) as published in their RSS feed. Play Podcasts does not host this file. Rights-holders can request removal through the copyright & takedown page.
Show Notes
This story was originally published on HackerNoon at: https://hackernoon.com/your-first-interactive-plot-in-python-a-hands-on-plotly-guide.
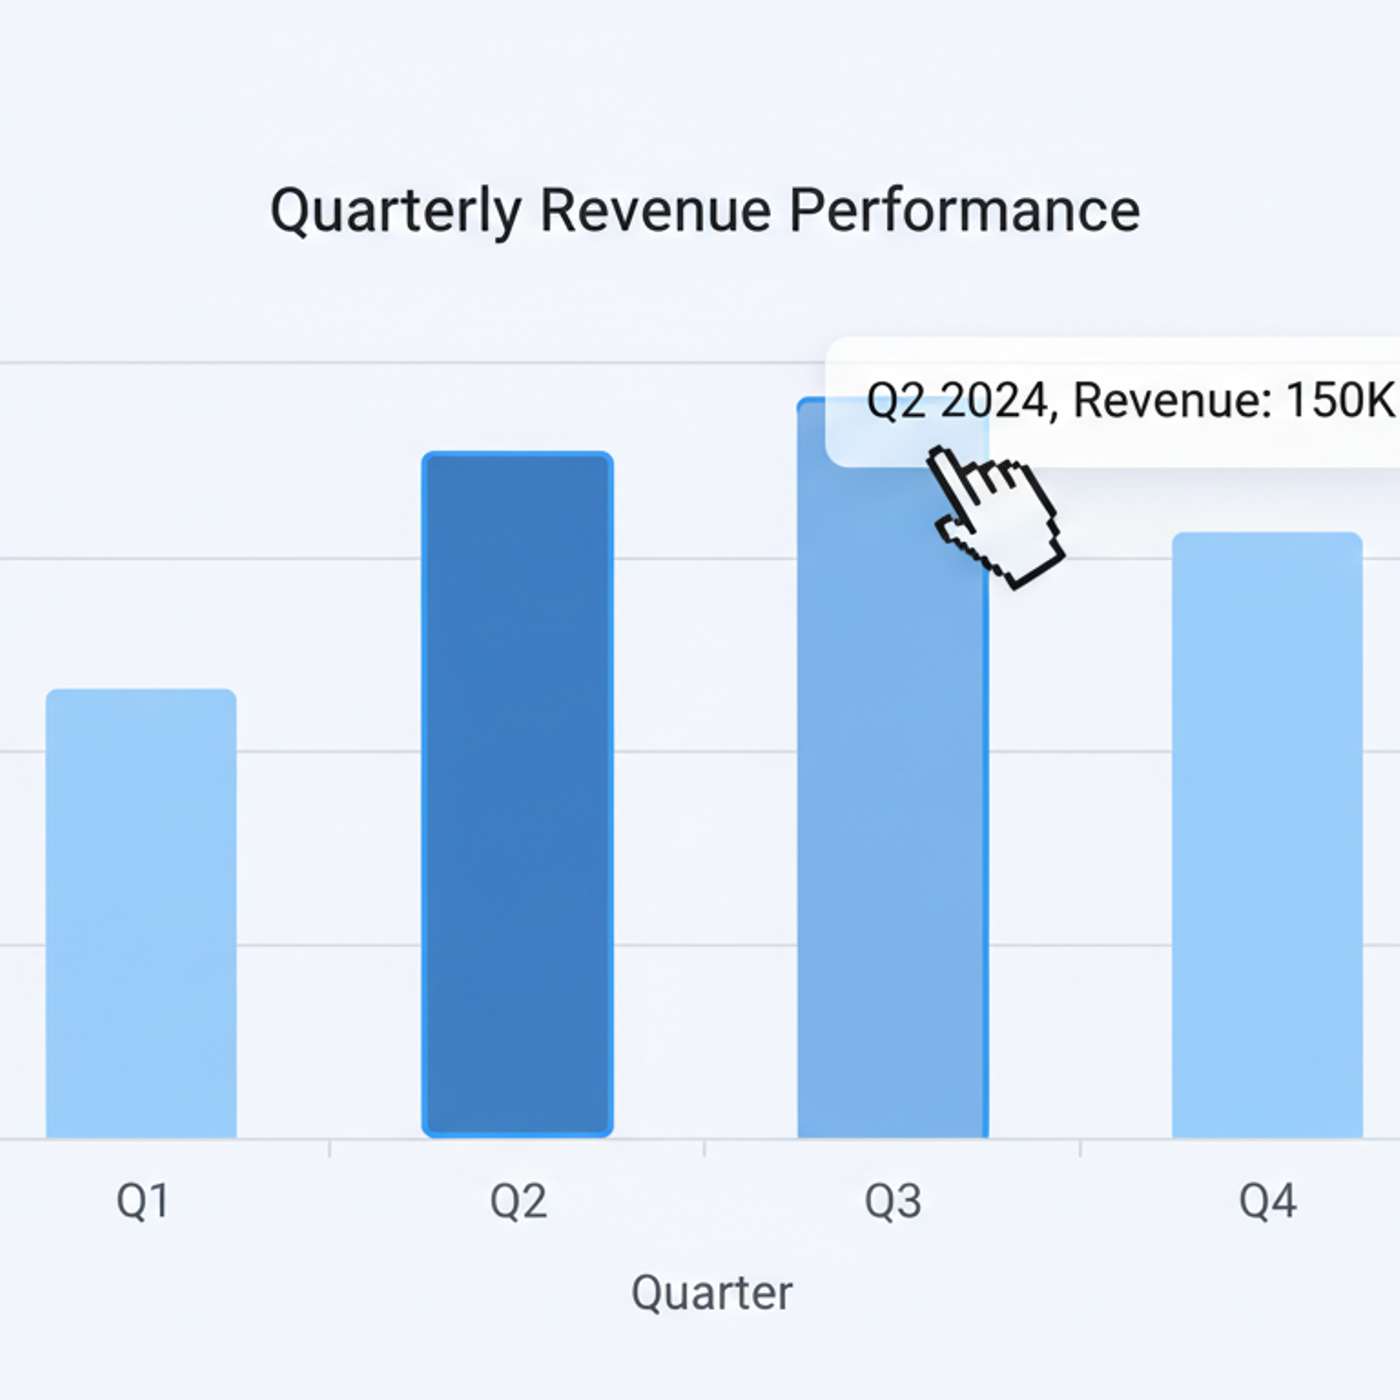
Plotly is a Python toolbox that lets you create interactive charts.
Check more stories related to programming at: https://hackernoon.com/c/programming.
You can also check exclusive content about #python, #data-science, #plotly, #charts, #matplotlib, #python-toolbox, #interactive-charts-python, #python-charts, and more.
This story was written by: @programmingcentral. Learn more about this writer by checking @programmingcentral's about page,
and for more stories, please visit hackernoon.com.
Plotly is a Python toolbox that lets you create interactive charts. The magic of Plotly lies in a fundamental change in how a visualization is created and rendered. Plotly offers two distinct but related APIs, each designed for a different stage of the analytical workflow.